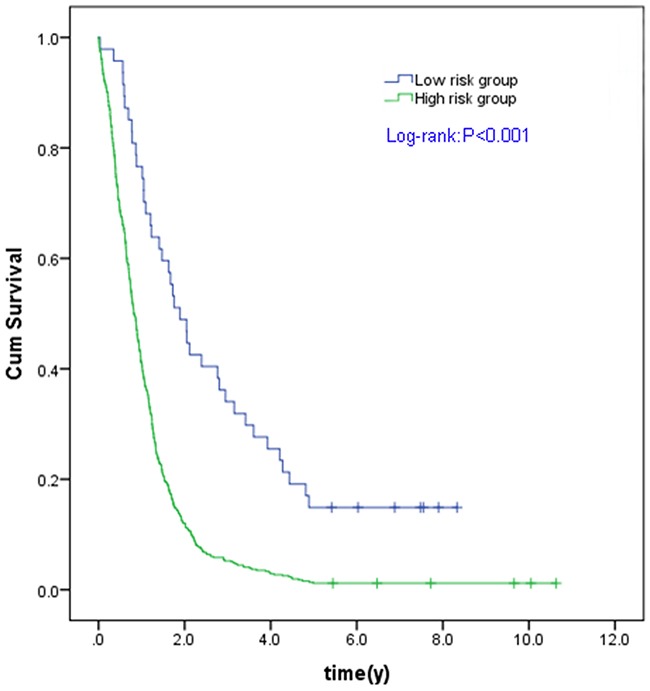
Figure 3. Kaplan Meier curves for the three microRNA signature in TCGA GBM cohort.

Individual patient was scored according to the three miRNAs signature. The Kaplan-Meier curves for GBM risk groups obtained from the TCGA cohort divided by the cut-off point. The OS of high risk group is significantly lower than that of low risk group in all GBM patients (C). The P values of the log-rank tests are <0.001.
