
Figure 5. Osthole induced breast cancer cells apoptosis.
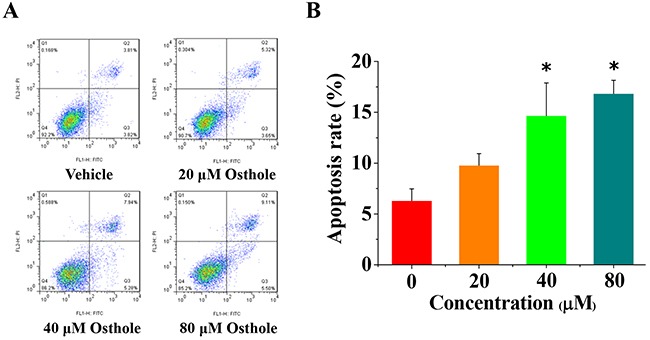
(A) Representative flow cytometry analysis data from Annexin V-FITC/PI staining. Cell apoptosis levels from cells treated with either osthole or vehicle were assessed at 24 h. (B) Quantitative results of cell apoptosis determined using Annexin V-FITC/PI flow cytometry analysis and expressed as the mean ± SD of three experiments. * p < 0.05 vs. vehicle.