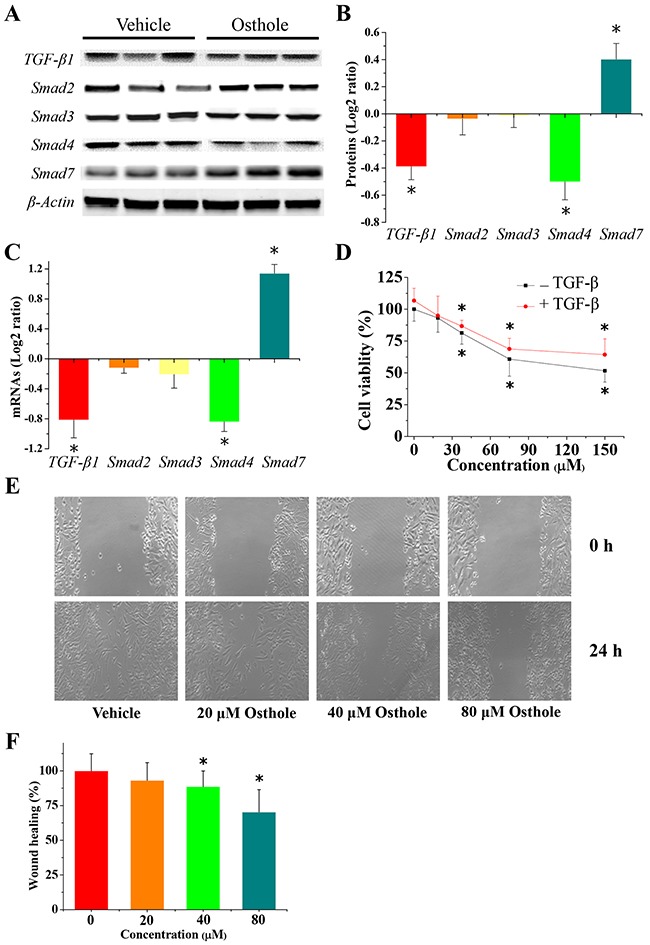
Figure 6. Alteration in gene expression of TGF-β/Smads signal pathway.

(A) Representative images of protein expression detected by western blotting. Cells were treated with or without 80 μM osthole for 24 h. Protein lysates were separated by SDS-PAGE and subjected to western blotting analysis using the specific antibodies indicated. (B) Quantification of the results of the protein expression (log2-ratio vs. vehicle; mean ± SD). Scanning densitometry was used for semiquantitative analysis for comparison to the vehicle-treated group. Results are expressed as the mean ± SD from three experiments. * p < 0.05 vs. vehicle. (C) Osthole-regulated TGF-β and Smad family gene expression. Cells were treated with or without 80 μM osthole for 24 h. Cells were collected and total RNA was extracted and analyzed using RT-qPCR. Measurements for RT-qPCR (log2-ratio vs. vehicle; mean ± SD) in 6 individual mRNA samples obtained from MDA-231BO cells treated with or without osthole. * p < 0.05 vs. vehicle. (D) Osthole treatment inhibited MDA-231BO cell viability when pretreated with TGF-β1. Cells were pretreated with 2 ng/mL TGF-β1 for 3 h, then were treated with indicated concentration of osthole for 24 h, and finally were measured by MTT assays. Results are expressed as mean ± SD for three experiments (* p < 0.05 by ANOVA). (E) Representative images from wound healing assays using cells treated with either osthole or vehicle were taken at 0 h and 24 h, when pretreated with TGF-β1. Cells were pretreated with 2 ng/mL TGF-β1 for 3 h, and then incubated with or without the indicated concentrations of osthole. After 24 h treatment with or without osthole, wound healing assays were begun, and representative scrape lines were imaged. (F) Wound closure was quantified as percentage of the wound closure from the control group, and expressed as the mean ± SD of three experiments. (* p < 0.05 by ANOVA).
