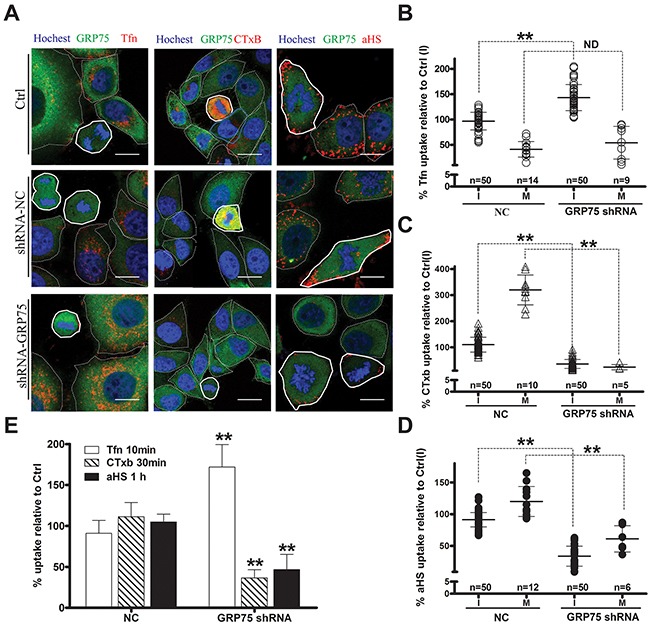
Figure 6. GRP75 knock-down promotes CME but inhibits CIE.

The uptake levels of Tfn-AF647, CTxB-AF647, and andαHS-AF647 complexes in GRP75-shRNA stably transduced HeLa cells were determined by confocal imaging analysis, and representative images are shown in (A). Scale bar: 20 um. Scatterplots depict the uptake variability of indicated ligands, and the uptake levels in the M (polygons with bold solid line) or I phase (polygons with thin dotted line) cells are respectively quantified in (B), (C) and (D) with comparison to that of untransfected cells in the I phase as Ctrl (I). At least 50 cells were counted for the I phase and ≥5 cells were counted for the M phase for each transfection. (E) The uptake levels of EGFP-positive shRNA cell populations were analyzed and quantified by FACS. 10,000 cells were counted per sample in each experiment. Statistically significant differences compared with negative control cells (NC-shRNA) are shown: ** P <0.01, ND: no difference.
