
Figure 5. Relative expression levels of target genes of miR-20a.
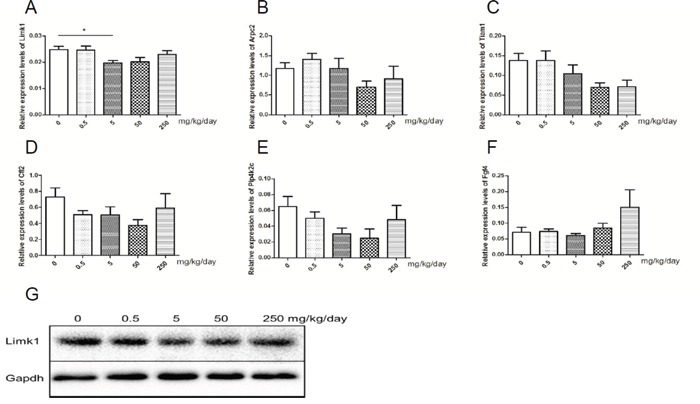
(A-F) represents relative expression level of Limk1, Arpc2, Tiam1, Cfl2, Pip4k2c and Fgf4 in mice testis, respectively. N = 20 per group. G represents levels of protein of LIMK1 in mice testis. *P < 0.05 versus control group.