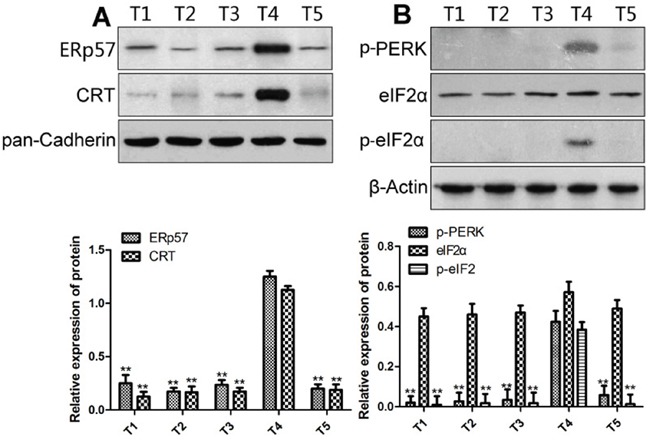
Figure 1.

The membrane expression of CRT (A) and ER stress-related proteins (B) in EC cells from drug-sensitive and resistant patients. Upper panels, representative Western blots; lower panels, relative protein levels. * and ** denote significantly difference vs T4 patient at P < 0.05 and 0.01 levels, respectively.
