
Figure 2. DC represses mTOR signaling and inhibition of autophagy prevents DC-induced cell death.
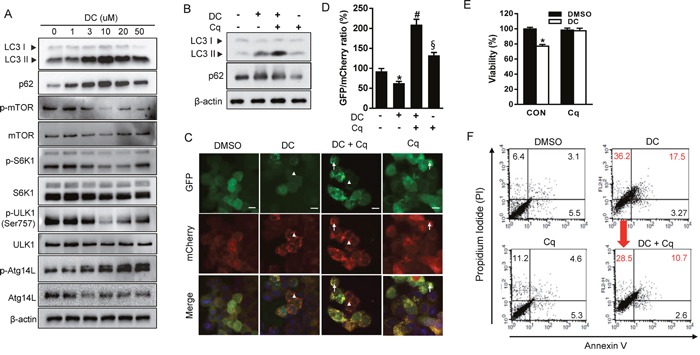
(A) Cells were treated with increasing concentration of DC for 24h. Cell lysates were analyzed for LC3, p62, mTOR, p-mTOR (Ser2448), S6K1, p-S6K1 (Thr389), ULK1, p-ULK1 (Ser757), ATG14L1, or p-ATG14L (Ser29) by immunoblotting. (B) Cells were treated with 10 μM DC and/or 10 μM chloroquine (Cq). Cells lysates were analyzed for LC3 or p62 by immunoblotting. (C) mCherry-GFP-LC3 stable Huh7 cells in 8-well chamber slides were treated with 10 μM DC and/or 10 μM Cq for 24h. A representative microscopy image showing red-colored autolysosomes (arrowheads) and yellow-colored autophagosomes (arrows). Scale bar = 10 μm. (D) Quantification of mCherry-GFP-LC3 puncta. The data are presented as percentage of GFP/mCherry ratio. Data are mean ± SEM; n=10. *P <0.05 vs. control DMSO; #P <0.05 vs. DC; §P <0.05 vs. DC + Cq. (E) MTT assay and (F) Annexin V-FITC/PI double staining in cells treated with 10 μM DC and/or 10 μM Cq for 24h. Data are mean ± SEM; n=3. *P <0.05 vs. control DMSO.