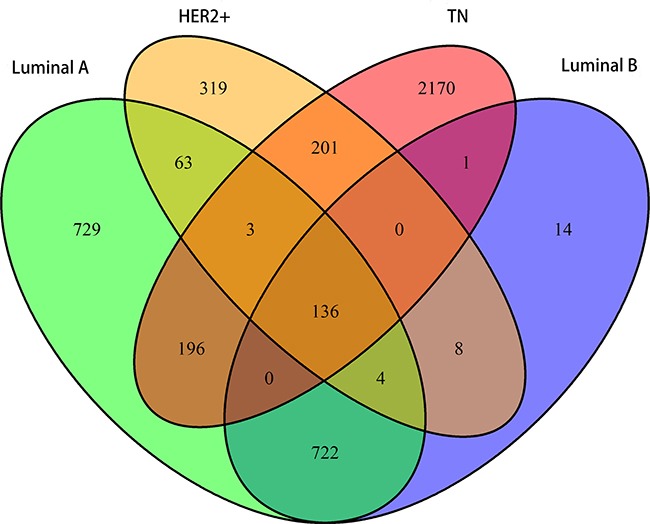
Figure 1. Venn diagram showing overlapping and unique subtype-specific genes.

Green: LA breast cancer subtype; blue: LB; orange: HER2+; red: TN. 136 genes overlapped between the four specific gene sets. LA, luminal A; LB, luminal B; HER2+, human epidermal growth factor receptor 2 positive; TN, triple negative.
