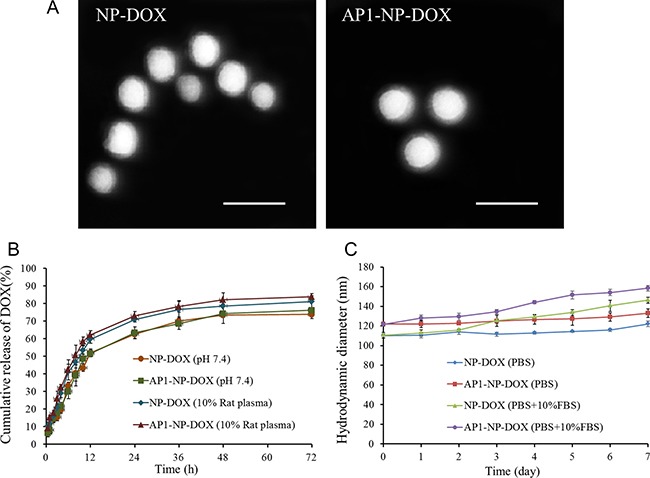
Figure 1.

(A) The morphology of NP-DOX and AP1-NP-DOX photographed with the transmission electron microscope. The bar represents 200 nm. (B) Cumulative release (%) of doxorubicin from DOX formulations in different media. (C) Stability study of NP-DOX and AP1-NP-DOX in PBS containing or without 10% FBS.
