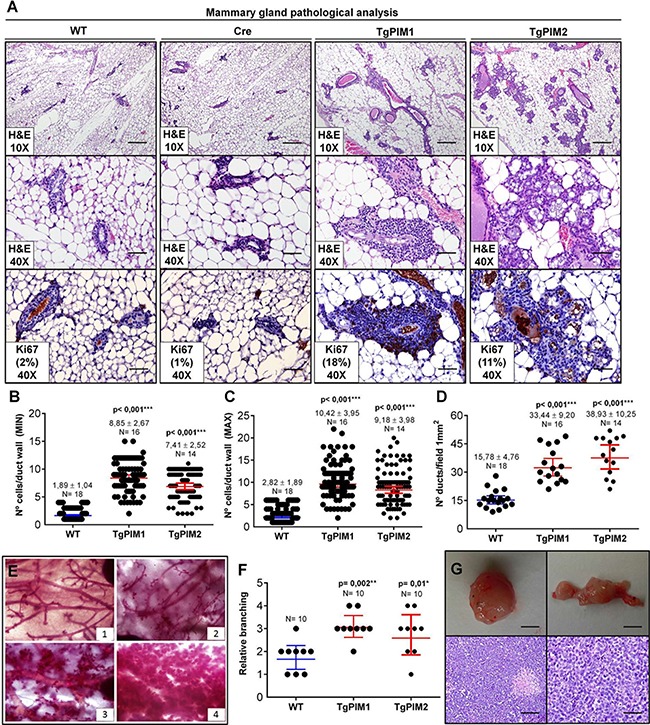
Figure 1. Pathological analysis of the mammary gland in TgPIM1/TgPIM2 transgenic models.

(A) Breast pathological analysis by Hematoxylin-Eosin staining (H&E) and Ki67 proliferation marker immunostaining of sections of the left hind leg mammary gland of both PIM models, WT and Cre mice. Representative images of neoplastic mammary lesions are presented at 10× (scale bars, 200 μm) and 40× (scale bars, 50 μm). (B–C) Average number of epithelial cell layers per mammary duct. To this end, layers of the opposite points of the perpendicular axis, MIN columns (B), and layers at the opposite points of the longest diameter, MAX columns (C), were considered, and the number of cell layers was counted. (D) Average number of mammary ducts per 1mm2 field of the two PIM models and WT. (E) Whole mammary gland mounts of mice were stained with carmine red alum to visualize the structure of the ducts and alveoli. Four different categories of phenotypes could be distinguished: (1) normal structure similar to the one of young virgin female mice; (2) greater than four-fold cystic dilation (of the ducts); (3) increased number of ramifications and strongly increased alveolar size; and (4) extreme alveolar hyperproliferation covering the space between the ducts to greater than 70%. (F) Mammary gland phenotypes of TgPIM1/TgPIM2 and WT mice. Points indicate the median of each mouse cohort classified according to (E). (G) Representative images of mammary gland tumors found in TgPIM1 mice. Upper images show a macroscopic view of tumors (scale bars, 1 cm). Lower images show H&E staining, left at 20× (scale bar, 100 μm) and right at 40× (scale bar, 50 μm). All images were captured by an Olympus BX-61 microscope and analyzed by Adobe Photoshop CS4. The p-value was obtained using the Wilcoxon signed rank test (*p < 0,05), (**p < 0,01) and (***p < 0,001).
