
Figure 2. Ghrelin increases the c-Fos-positive cells in hippocampus.
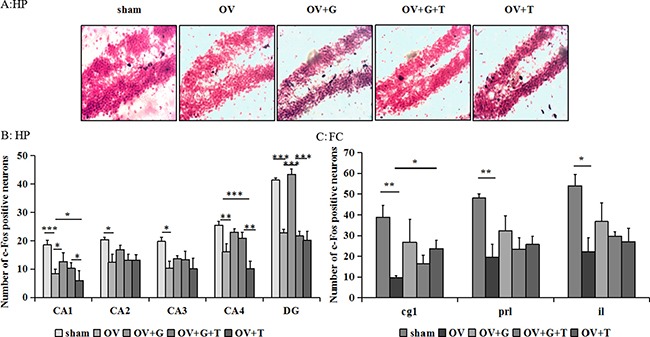
(A) Representative sections through the dentate gyrus (inset: greater magnification near the tip of the dentate), showing c-Fos stained cells (dense brown nuclear staining) and counterstaining with neutral red. (B) The number of c-Fos positive cells in the dentate gyrus of the hippocampus. (C) The number of c-Fos positive cells in the subregions of the frontal cortex: Cg1, IL, and PrL. Group conditions are indicated by the following letters and abbreviations. HP: hippocampus; FC: frontal cortex; Sham: sham treatment; OV: ovariectomy; G: Ghrelin (1 mg/kg); T: tamoxifen (15 mg/kg). Values are mean ± S.E.M, n = 3–11, Symbols represent significant post hoc comparisons: Tukey's HSD, *P < 0.05, **P < 0.01 and ***P < 0.001.