
Figure 5. Ghrelin possible involve CREB signaling pathway.
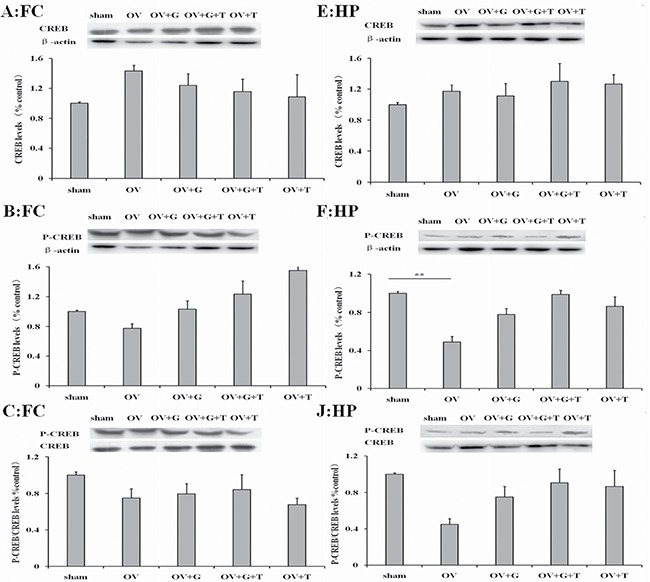
Figures represent the CREB, pCREB and pCREB/CREB ratios in the frontal cortex (A–C) and hippocampus (E, F and J). Group conditions are indicated by abbreviations and doses by numbers. HP: hippocampus; FC: frontal cortex; Sham: sham treatment; OV: ovariectomy; G: Ghrelin (1 mg/kg); T: tamoxifen (15 mg/kg). Values are mean ± S.E.M, n = 4, Symbols represent significant post hoc comparisons: Tukey's HSD, **P < 0.01.