
Figure 6. Schematic illustration of BMSCs transplantation differentiation, migration and distribution diagram.
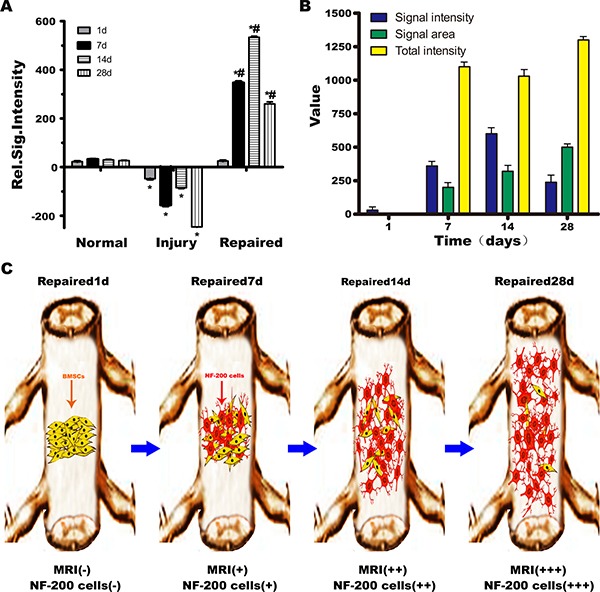
(A) Normal group, Injury group and Repaired group rats MRI signal intensity relatively statistical histogram. *P < 0.05 verus Normal, #P < 0.05 verus Injury. (B) The T1WI signal intensity distribution in Repaired group in different time (1, 7, 14, 28 days). The T1WI signal strength increased with the extension of time, at 14th day peaked, and then began to decline. The area of high signal intensity increased with the extension of time, and the biggest area of high signal intensity appeared at 28th day. The weighted total signal strength was on the rise. (C) Schematic illustration of BMSCs transplantation differentiation, migration and distribution diagram. In the 7th day, NF-200 positive cells were observed near the injection point, suggesting that the BMSCs had differentiated into neurons and were mainly concentrated at the site of SCI. The number of NF-200 positive cells reached a maximum at 14th day, and then gradually distributed along the segmental injury to 28th day, NF-200 positive cells distributed to both ends of the injury of spinal cord.