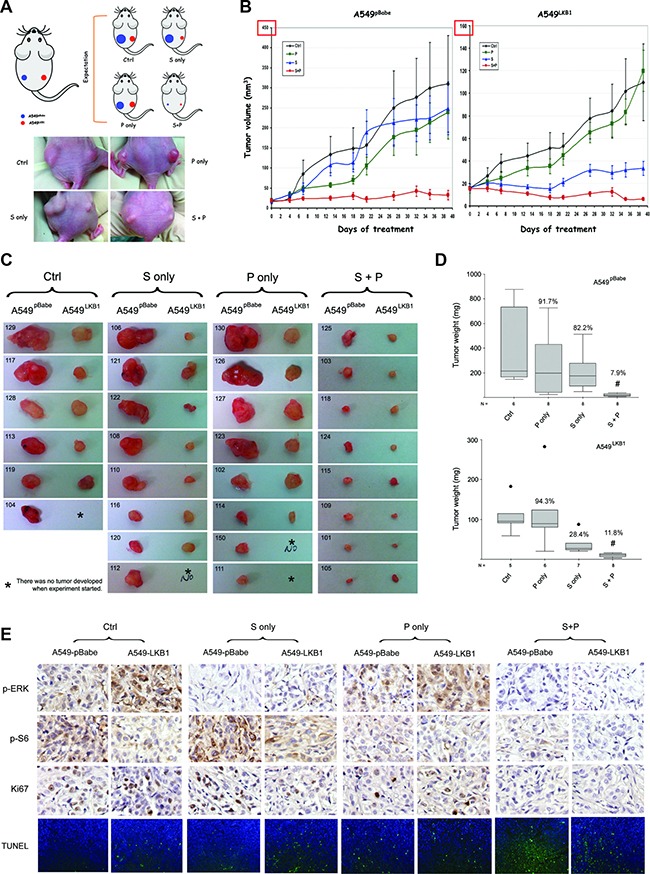
Figure 4. Phenformin enhances the therapeutic effect of selumetinib in vivo regardless of LKB1 status.

(A) Upper panel: illustration of the xenograft model in nude mice. ~ 1.5 million A549pBabe and A549LKB1 cells were implanted on the left and right flank of nude mice respectively. Treatment started once the tumors became palpable. Mice were orally gavaged daily with DMSO (ctrl), selumetinib (S, 50 mg/kg), phenformin (P, 100 mg/kg) or the combination (S+P), 5 days per week. Lower panel: representative mouse from each group on day 26 post-treatment. (B) Xenograft tumor growth curve. A549LKB1 tumors were smaller than A549pBabe tumors, consistent with the tumor-suppressing function of LKB1. A549pBabe tumors were resistant to selumetinib whereas A549LKB1 tumors were sensitive, consistent with in vitro data shown in the previous figures. Although A549pBabe tumors were more sensitive to phenformin initially, growth of some tumors quickly caught up resulting in no statistical difference after day 18. The combination of S and P potently inhibited the growth of tumors of both A549pBabe and A549LKB1 cells. (C) All tumors harvested from the mice. Tumors of A549pBabe and A549LKB1 cells from the same mice were placed next to each other. Some mice did not develop tumor from A549LKB1 cells (labeled with *). The individual number indicates each individual mouse. The combination of selumetinib and phenformin demonstrated potent inhibition. (D) Box-and-Whisker plots showing the weight of tumors in c. The medians of tumor weight from each group were compared using nonparametric Kruskal–Wallis test. Tumors treated with combination therapy had the lowest weight (i.e. smallest). The percentage of median tumor weight over the control is shown on each Box-and-Whisker plot. (E) Representative IHC staining of p-ERK, p-S6, Ki67, and representative TUNEL staining of tumor sections from different groups with alternative LKB1 status. Again, the combination of selumetinib and phenformin resulted in the lowest signals of p-ERK, p-S6, Ki67 and TUNEL staining. The # denotes statistical significance (p < 0.01 in either case).
