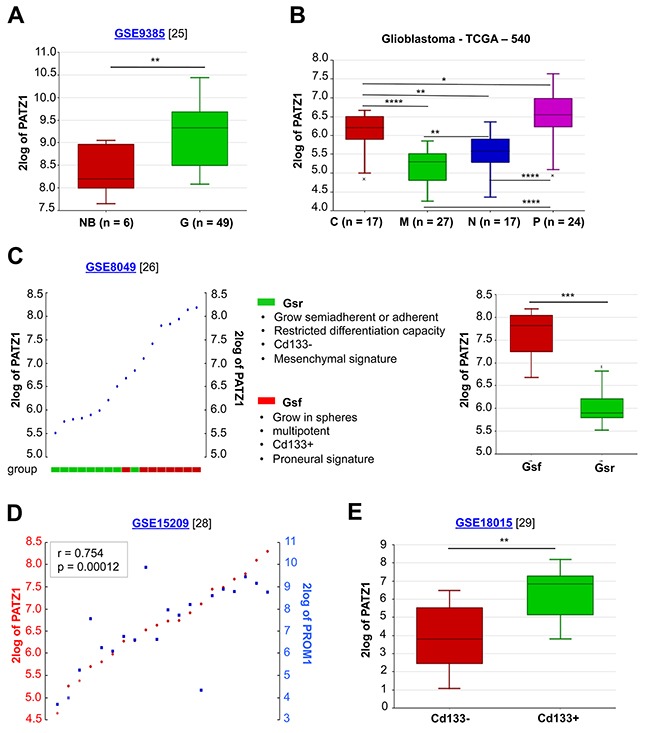
Figure 3. In silico meta-analysis of PATZ1 expression in human GBM tissues and cell lines.

(A) Box-plot comparing PATZ1 expression in normal brain (NB) and gliomas of different grade (G). The data were analyzed by one-way analysis of variance (ANOVA) through the R2 web platform. (B) Box-plot showing PATZ1 expression in the different GBM subtypes and statistical analysis of the differences among them. C = classical, M = mesenchymal, N = neural, P = proneural. The data were analyzed by one-way analysis of variance (ANOVA) through the R2 web platform. (C) On the left, YY-plot in GSCs (ordered by PATZ1 expression). The cells are divided in two group as indicated in the figure. On the right, box-plot comparing PATZ1 expression in the two groups. (D) YY-plot correlating PATZ1 and PROM1 expression in stem cells derived from GBM (n = 7), oligoastrocytoma (n = 2), normal human foetus (n = 5) and primary biopsies of non-malignant brain tissue (n = 6). Significance of correlation (inbox) was analyzed by Pearson's χ2 test through the R2 web platform (http://r2.amc.nl). (E) Box-plot comparing PATZ1 expression in primary GBM sorted for Cd133 expression (negative/positive). The data were analyzed by one-way analysis of variance (ANOVA) through the R2 web platform. *, p < 0.05; **, p < 0.01; ***, p < 0.001; ****, p < 0.0001. Datasets for each cohort of samples are indicated in the figure with the relative reference in brackets. 2log of PATZ1 = logarithmic values of PATZ1 expression with base of 2.
