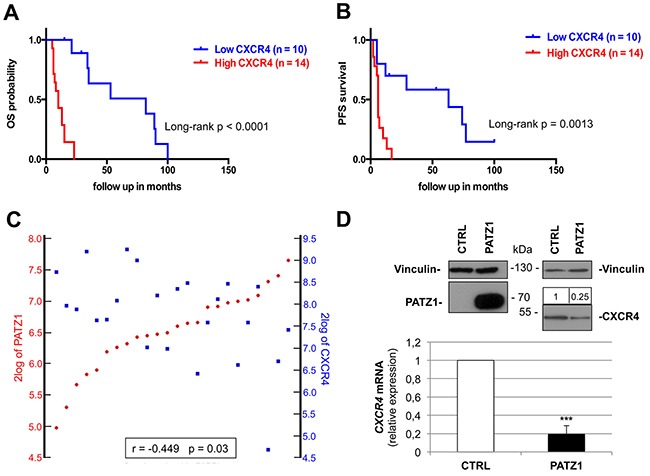
Figure 7. CXCR4 expression correlates positively with worse survival and negatively with PATZ1 in proneural GBM patients.

(A) Overall (OS) and (B) progression-free (PFS) Kaplan-Meier survival curves of the patients shown in Figure 7B-7C (proneural subset of the TCGA dataset of GBM). Note that patients with higher CXCR4 expression have worse survival rates than patients with lower CXCR4, as assessed by log-rank test. (C) YY-plots correlating PATZ1 and CXCR4 expression in the proneural GBMs shown in A and B. Significance of correlation (inbox) was analyzed by Pearson's χ2 test through the R2 web platform (http://r2.amc.nl). (D) VS-GB cells were transiently transfected with 10 μg PATZ1 expressing plasmid, and endogenous CXCR4 mRNA was measured 48h later by qRT-PCR. CXCR4 mRNA levels were normalized for endogenous β-actin levels. The mean ± SE of three independent experiments, each in duplicate, is reported. ***, P = 0.001. PATZ1 and CXCR4 protein expression is shown on the top by western blot analysis, using vinculin detection as a loading control. Densitometric analysis by Image J software was applied: relative expression levels of CXCR4, compared to empty vector-transfected control and normalized with respect to vinculin, are indicated on the top of the blot.
