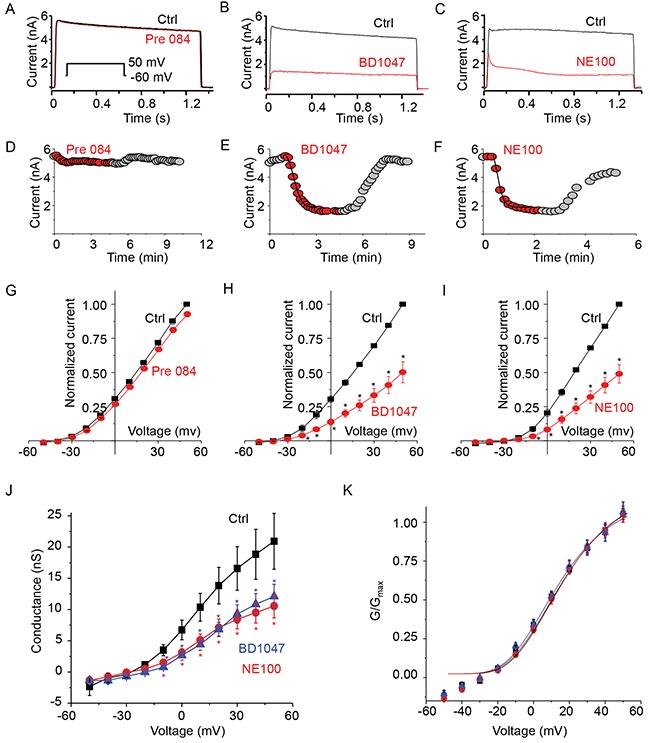
Figure 1. Only s1-R antagonists inhibit Kv2.1 channel current.

(A) Representative current traces from a cell expressing Kv2.1 channel before (HR; black trace) and during treatment with σ1-R receptor agonist PRE084 (10 μM, red trace). Inset voltage pulse to 50 mV from a holding potential of -60 mV. (B) Representative Kv2.1 channel current traces from a cell treated with σ1-R antagonist BD1047 (50 μM, red trace) compared to total current (black trace). (C) Comparison of Kv2.1 current traces before (HR, black trace) and during treatment with σ1-R antagonist NE100 (50 μM, red trace). (D) Time course of current amplitude at +60 mV. Recordings during Pre84 treatment is represented as red filled circles. (E) Filled circles (red) showing current amplitude time course during treatment of Kv2.1 expressing cells with BD1047. (F) Kv2.1 outward current amplitude as in D in presence of NE100 (50 μM, red filled circles). Both in E and F the solid line represents single exponential curve fit. (G) Average Kv2.1 whole-cell normalized current-voltage plot obtained in control solution (black squares) and during application of Pre084. (H) Comparison of average normalized current-voltage curve in presence of control bath solution and BD1047. (I) Average normalized current-voltage curve determined in control solution (black squares) and NE100 (red circles). (J) The G-V relationships of the control (solid black square), and in presence of BD1047 (blue triangle) or NE100 (red circle) are illustrated. (K) Normalized G-V curves as in J were fitted with the Boltzmann function. Data points in G-K are mean ± SEM (n=5). * P < 0.05 compared to control.
