
Figure 4. Summary of σ1 and 2-R ligands inhibition of Kv2.1 current.
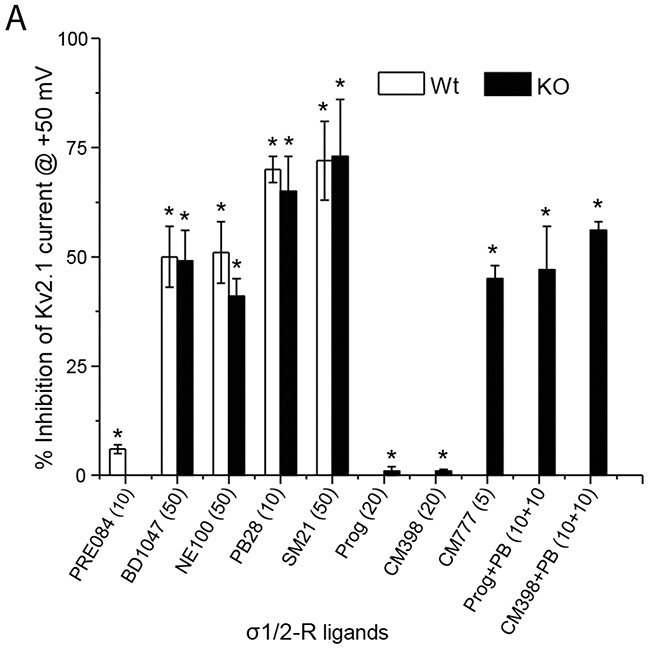
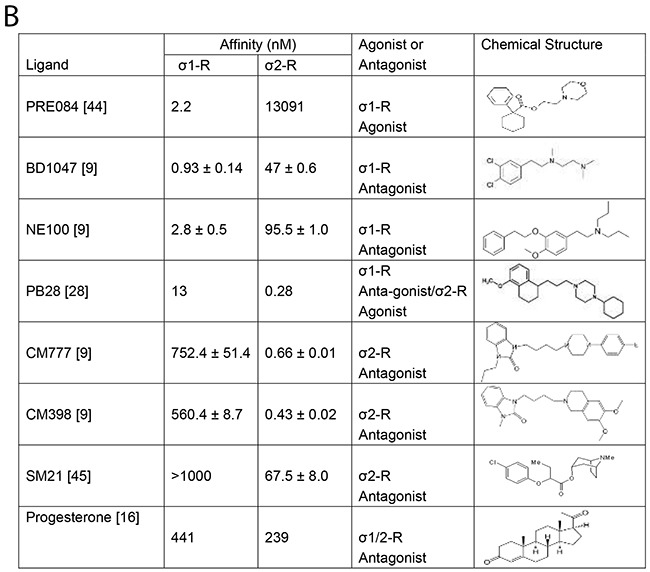
(A) Bar graph summary of average % inhibition of Kv2.1 channel in HEK293 cells (open bar) or after σ1-R knockout (black bar) in HEK 293 cells in presence of various σ1- and σ2-R ligands. Data is mean ± SEM (n = 4 at least) and *P < 0.05. Concentrations of the ligands are presented in the parentheses under the bar graph. (B) σ1-R and σ2-R binding affinities, functions, and chemical structures of σ1-R ligands.