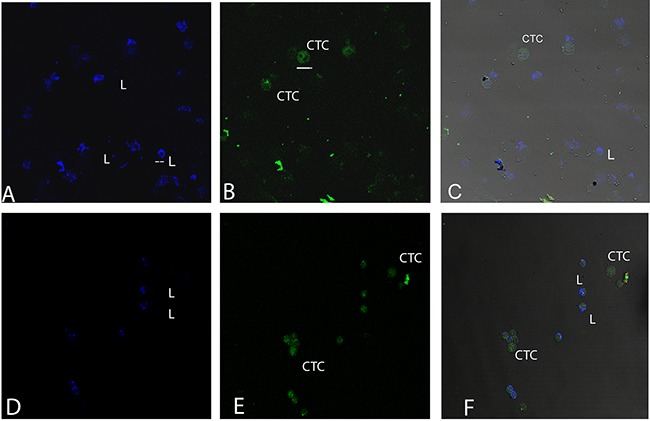
Figure 5. Cytomorphological differences between lymphocytes and CTCs.

Blood samples of patients where CTCs and lymphocytes are observed. (A, D) labelling with CD45 for lymphocyte detection. (B, E) labelling with Cytokeratin for CTC detection. (C, F) merge of both labels. Bars in figure B below CTC correspond to 16 microns and bars figure A in lymphocyte correspond to 8 microns.
