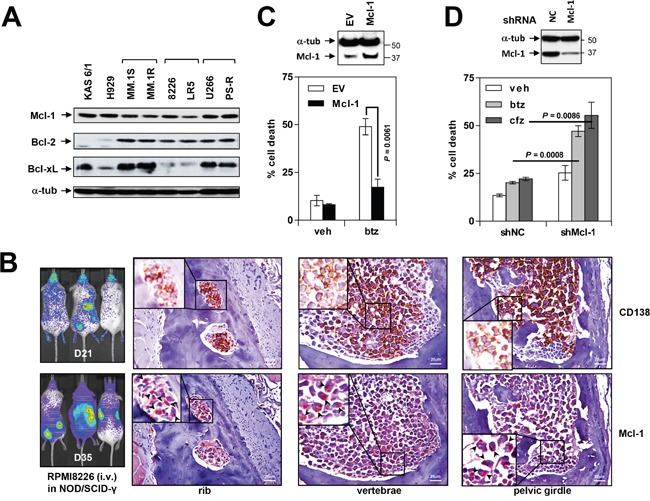
Figure 1. Mcl-1 is highly expressed in MM cell lines in vitro and in vivo and is associated with bortezomib resistance.

(A) Immunoblotting analysis was performed as described in Methods to profile basal expression levels of Mcl-1, Bcl-2 and Bcl-xL in untreated human MM cell lines. Lanes were loaded with 30 μg of protein; α-tubulin controls were assayed to ensure equivalent loading and transfer. (B) NOD/SCID-γ mice were injected intravenously with 5×10⁶ luciferase-labeled RPMI8226 cells and images captured at day 21 and 35 with the Xenogen IVIS 200 imaging system. In addition, rib, vertebrae and pelvic girdle sections were stained with anti-CD138 and Mcl-1 antibodies, after which images were obtained with an IX71-Olympus inverted system microscope. Scale bar = 20 μm. (C) U266 cells were stably transfected with an Mcl-1 construct. Cells were then exposed to 5 nM bortezomib (btz) for 24 hr, followed by flow cytometry to monitor the percentage of apoptotic (Annexin V+) cells. Values represent the means ± S.D. for three experiments performed in triplicate. (D) PS-R cells were stably transfected with constructs encoding shRNA targeting Mcl-1 (shMcl-1) or scrambled sequence as a negative control (shNC). Cells were then exposed to 15 nM btz or 25 nM carfilzomib for 24 hr, followed by flow cytometry to determine the percentage of apoptotic (annexin V+) cells. Values represent the means ± S.D. for three experiments performed in triplicate.
