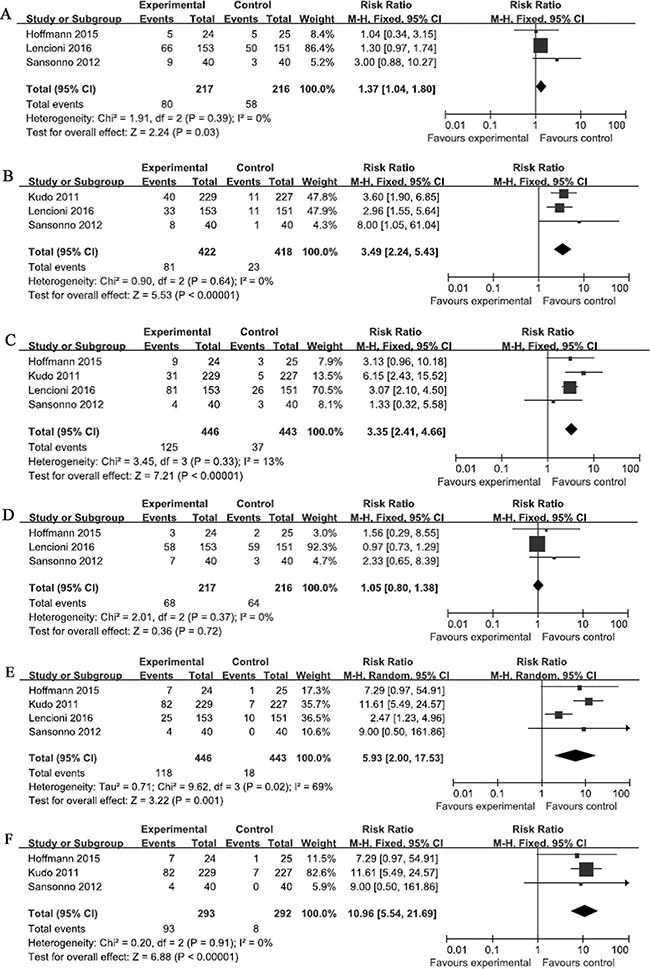
Figure 4. Comparisons of the risks of adverse events.

Forest plots depict the comparisons of the risks of (A) fatigue, (B) rash, (C) diarrhea, (D) nausea in the relevant studies, and the comparisons of hand and foot skin reactions in (E) all of the selected studies and (F) the studies in which drug-eluting beads were not used. Squares represent the odds ratio for the experimental group compared with the placebo control group, with the size of the square being proportional to the number of cases evaluated. Error bars represent the 95% confidence interval, and the diamond-shaped object representing the pooled estimates within each analysis.
