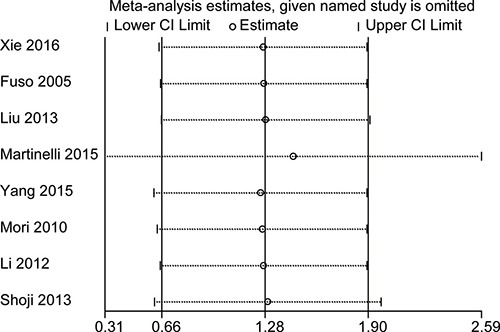
Figure 4. Sensitivity analysis for testing the robust of HR for 1-year OS.

The small circle indicates the estimated logHR, given the named study is omitted. Accordingly, the bar corresponds to the lower limit of 95% CI of the logHR.

The small circle indicates the estimated logHR, given the named study is omitted. Accordingly, the bar corresponds to the lower limit of 95% CI of the logHR.