
Figure 4. Subgroup analysis of 1-year and 3-year survival rates and APE1 expression.
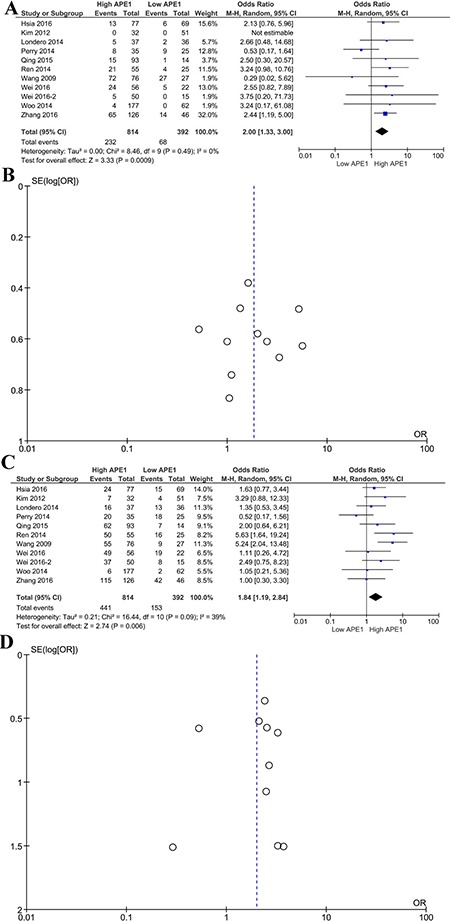
Forest plot (A) of the hazard ratio for the association of APE1 levels and 1-year survival rate; Begg's funnel plots of publication bias (B) for meta-analysis of 1-year survival rate of high and low APE1 expression; forest plot (C) of the hazard ratio for the association of APE1 levels and 3-year OS; Begg's funnel plots of publication bias (D) for meta-analysis of 3-year survival rates of high and low APE1 expression.