
Figure 3. Subgroup analysis of cancer types.
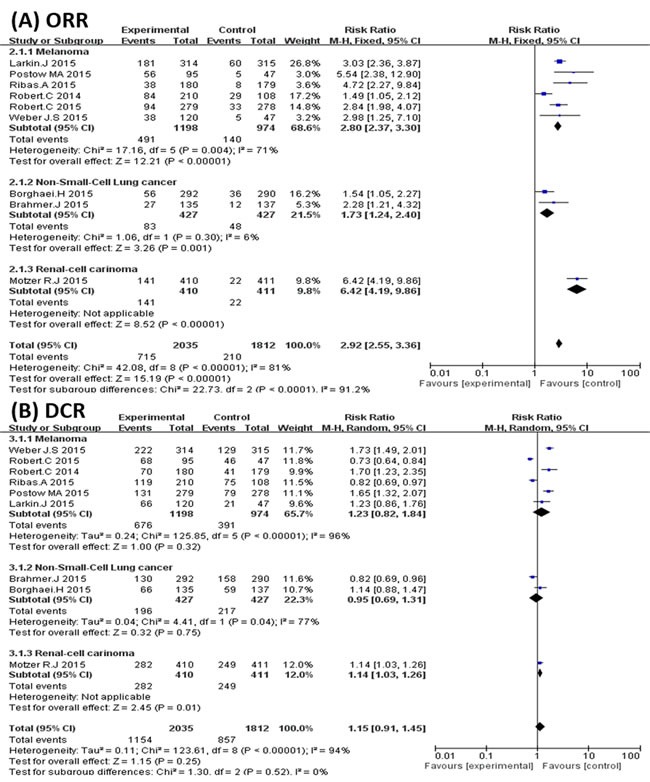
A. Forest plots of the pooled Relative Risk (RR) of objective response rate (ORR); B. Forest plots of the pooled Relative Risk (RR) of disease control rate (DCR).
Official websites use .gov
A
.gov website belongs to an official
government organization in the United States.
Secure .gov websites use HTTPS
A lock (
) or https:// means you've safely
connected to the .gov website. Share sensitive
information only on official, secure websites.
A. Forest plots of the pooled Relative Risk (RR) of objective response rate (ORR); B. Forest plots of the pooled Relative Risk (RR) of disease control rate (DCR).