
Figure 4.
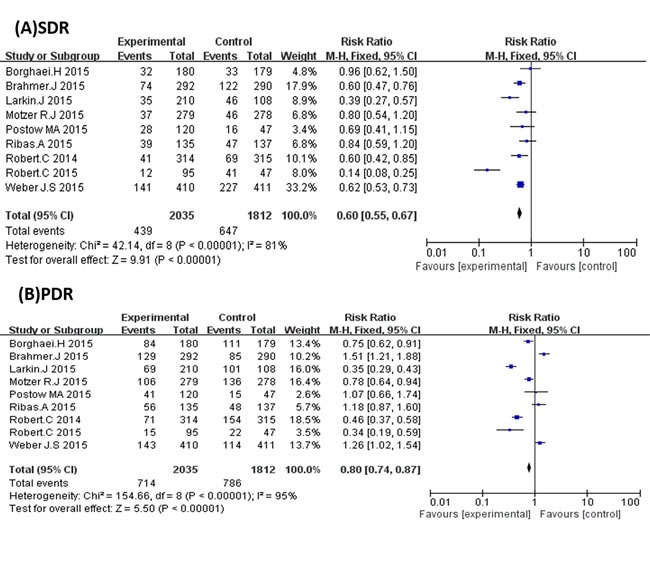
A. Forest plots of the pooled Relative Risk (RR) of stable disease rate (SDR) and B. Forest plots of the pooled Relative Risk (RR) progressive disease rate (PDR).
Official websites use .gov
A
.gov website belongs to an official
government organization in the United States.
Secure .gov websites use HTTPS
A lock (
) or https:// means you've safely
connected to the .gov website. Share sensitive
information only on official, secure websites.
A. Forest plots of the pooled Relative Risk (RR) of stable disease rate (SDR) and B. Forest plots of the pooled Relative Risk (RR) progressive disease rate (PDR).