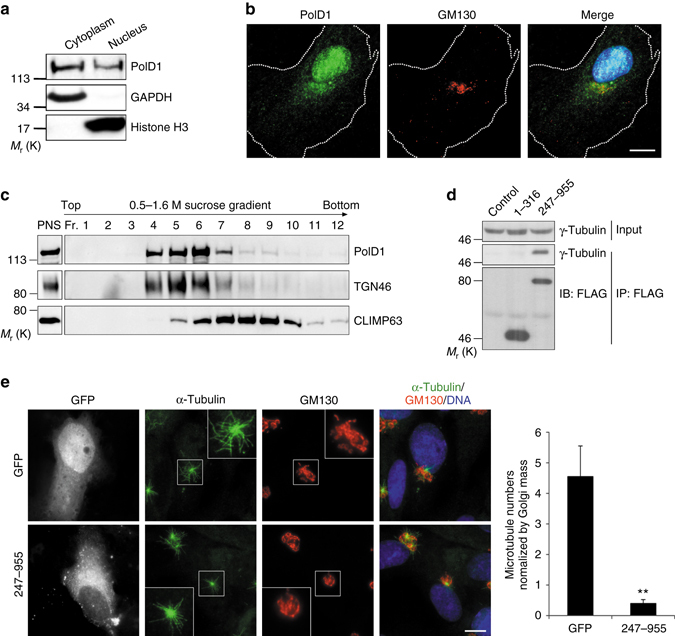
Fig. 5.

Subcellular distribution of PolD1. a RPE1 cell lysates were fractionated into cytoplasmic (Cytoplasm) and nuclear (Nucleus) fractions, and an equal proportion of each fraction was immunoblotted. The cytoplasmic protein GAPDH and the nuclear protein histone H3 were probed as fractionation controls. b RPE1 cells were double-stained for PolD1 and GM130. The images show a representative cell of at least three experiments; the white dashed lines indicate the cell boundary. The PolD1 intensity at the Golgi is ~ 22% of that in the nucleus. c The PNS from RPE1 cells was fractionated by equilibrium centrifugation over a sucrose gradient (0.5–1.6 M). Membranes were then pelleted, and each fraction (50%) and the PNS (4%) were analyzed. d The PolD1 fragments 1–316 and 247–955 were FLAG-tagged and ectopically expressed in HEK293T cells, and the extracts were used for anti-FLAG immunoprecipitation. The lysate inputs and the immunoprecipitates were analyzed by immunoblotting (IB). Control, FLAG vector. e A microtubule regrowth assay was performed on RPE1 cells transfected with GFP or GFP fused with the PolD1 fragment 247–955. The cells were then stained for microtubules (anti-α-tubulin) and GM130. The images shown are representative of at least three experiments (20 cells expressing GFP or GFP-tagged 247–955 at similar levels were analyzed at 1.5 min of regrowth). The numbers of Golgi-associated microtubules were determined and normalized by the Golgi mass. The data are presented as means ± s.d. and are representative of three independent experiments; ***p < 0.001, two-tailed, unpaired student’s t-test. Scale bars, 10 μm
