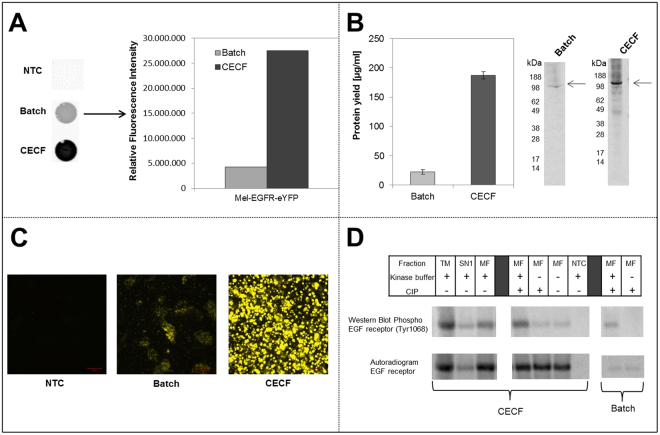
Figure 3.
Comparison of Mel-EGFR-eYFP cell-free synthesis in the batch and the CECF reaction format. (A) Fluorescence analysis of Mel-EGFR-eYFP using a Typhoon Trio + Variable Mode Imager (GE Healthcare) (excitation 488 nm, emission filter 526 nm short-pass). Quantification of fluorescence intensity was performed using Image Quant TL software (GE Healthcare). Fluorescence intensity was normalized with regard to the batch value. No template control (NTC) contained CHO cell-free translation mixture without addition of DNA template. (B) Quantification of total protein yields by TCA precipitation of synthesized Mel-EGFR-eYFP and scintillation measurement. Error bars represent the standard deviation of triplicate analysis. Autoradiography of corresponding samples after electrophoretic separation. (C) Analysis of Mel-EGFR-eYFP intensity and localization in cell-free reactions using confocal laser scanning microscopy (CLSM). (Scale bar 10 µM) (D) Analysis of in vitro phosphorylation of Mel-EGFR-eYFP tyrosine 1068 residue by immunoblotting. Comparison of western blot, displaying the phosphorylated EGFR, and corresponding autoradiography detecting the total amount of EGFR. CECF samples were separated into translation mixture (TM), supernatant (SN1) and microsomal fraction (MF). To verify the specificity of the phosphorylation by EGFR kinase, samples were treated with calf intestinal phosphatase (CIP) to enable dephosphorylation of EGFR prior kinase buffer treatment. No template control (NTC) contained CHO cell-free translation mixture without supplementation of DNA template. Image analysis of immunoblot and quantitative comparison with the corresponding autoradiography of the blot is illustrated in supplementary Figure 1. The original image of the western blot and the corresponding autoradiogram can be found in supplementary figure 8.

