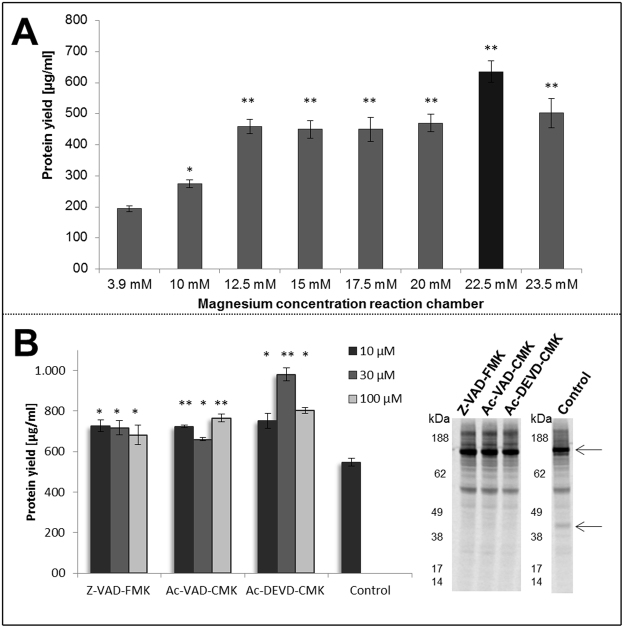
Figure 4.
Optimization of Mel-EGFR-eYFP protein yields in the CECF reaction mode. (A) Influence of magnesium concentration in the reaction chamber during CECF reaction. Radio labeled Mel-EGFR-eYFP was used to determine protein yield. Error bars represent the standard deviation of triplicate analysis. Asterisks indicate the significance of deviation with regard to the control experiment (3.9 mM magnesium)(*p < 0.05; **p < 0.01). (B) Supplementation of caspase inhibitors Z-VAD-FMK, Ac-VAD-CMK, Ac-DEVD-CMK in different concentrations (10 µM, 30 µM, 100 µM) to CECF reaction. The original image of the autoradiogram can be found in supplementary figure 9. Preliminary experiments were performed to make a preselection for appropriate caspase inhibitors (supplementary figure 3). Total protein yields of EGFR-eYFP were determined. Autoradiography of corresponding samples after electrophoretic separation was demonstrated. Error bars represent the standard deviation of triplicate analysis. Asterisks indicate the significance of deviation with regard to the non-treated control experiment (*p < 0.05; **p < 0.01).

