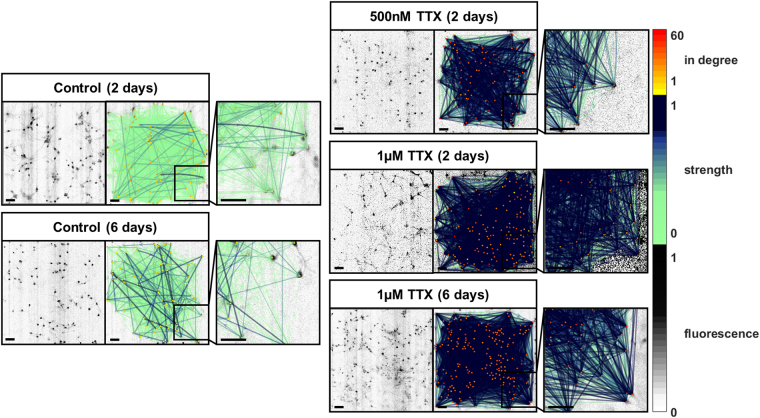
Figure 3.
Representative images of effective network reconstruction with connection strengths after TTX-induced silencing for 2 or 6 days. The panels show network plots with color-coded number of incoming connections (in degree) and connection strength (weight). Connection strength is represented by thin, light arrows if low and thick, dark arrows if high. The treatment of neuronal cultures with 500 nM TTX or 1 µM TTX for two or six days yielded effective networks with more connections and higher connection strengths. Scale bars = 100 µm.

