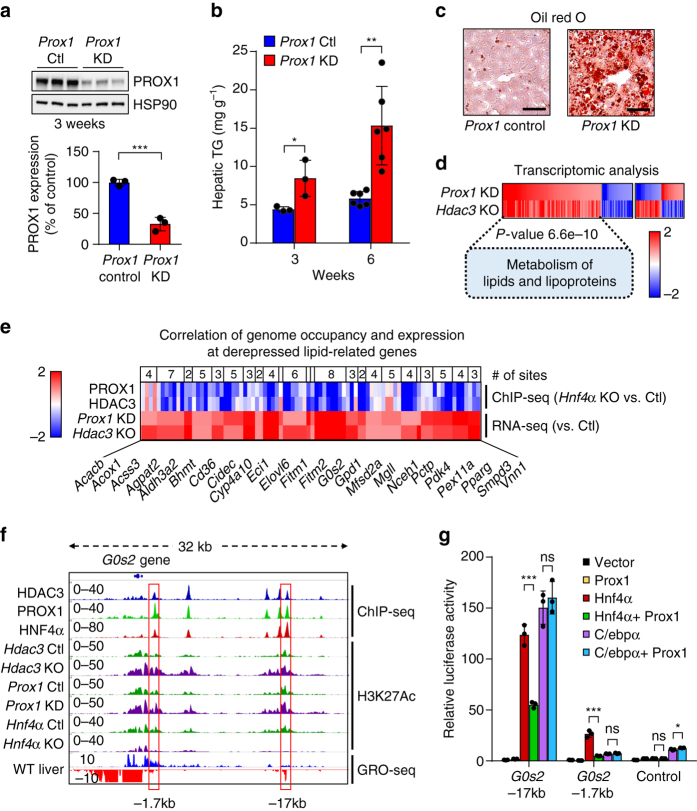
Fig. 4.
The HDAC3–PROX1 module suppresses steatosis by controlling a hepatic lipid metabolism gene program. a Western blot of liver samples from mice treated for 3 weeks with AAV8 TBG shLuciferase (Prox1 Ctl) or shPROX1 (Prox1 KD). Densitometry of the western blot shown above (n = 3). Data are presented as mean ± s.d. b Hepatic triglyceride assay of livers infected for 3 weeks (n = 3) or 6 weeks (n = 6) with indicated virus. Data are presented as mean ± s.d. c Oil red O staining of livers infected for 6 weeks as in (b). Scale bar is 50 µm. d RNA-seq analysis of Hdac3 fl/fl mice infected for 2 weeks with AAV8 TBG Egfp (n = 2) or Cre (Hdac3 KO, n = 3) vs. wild-type mice infected with AAV8 TBG shLuciferase (n = 3) or shPROX1 (Prox1 KD, n = 3) for 3 weeks. Heatmap displays coregulated genes (1.7-fold change, P < 0.05) grouped by expression correlation (135 genes) or anti-correlation (50 genes) upon ablation of HDAC3 or PROX1. Scale bar represents log2(fold change). Inset shows the P-value and corresponding gene list for the highest ranking Reactome pathway in the co-upregulated cluster. e Heatmap displays co-upregulated lipid-related genes upon ablation of HDAC3 or PROX1 and the corresponding binding strength of adjacent HDAC3–PROX1 co-bound peaks (−50kb upstream of the transcription start site, TSS through +2 kb from the transcription end site, TES) in the HNF4α KO liver relative to control. Scale bar represents log2(fold change) for RNA-seq and fold-change for ChIP-seq. f Example ChIP-seq and GRO-seq browser tracks at the G0s2 locus. Red boxes indicate location of putative G0s2 enhancers. g Luciferase assay (n = 3) indicating transcriptional response to co-expression of HNF4α, PROX1 and C/EBPα at G0s2 enhancers as identified in (f). Data are presented as mean ± s.d. Two-tailed unpaired Student’s t-test, *P < 0.05, **P < 0.01, ***P < 0.001, ns not significant

