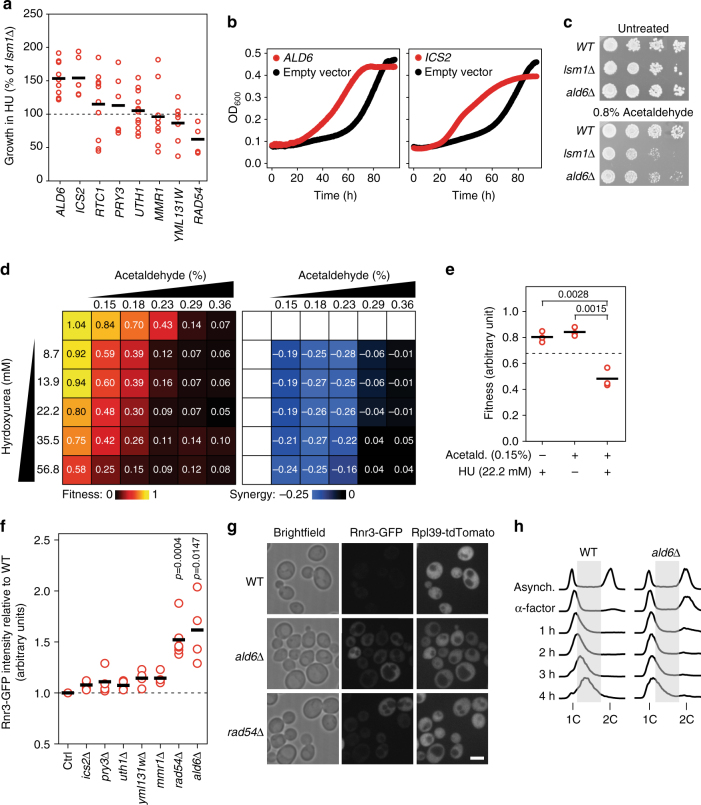
Fig. 7.
De-repression of the Yox1 target ALD6 is critical to detoxify acetaldehyde and promote DNA replication stress resistance. a Relative growth of lsm1∆ cells overexpressing the indicated genes compared to lsm1∆ cells containing the control vector. Each data point represents a single replicate. Each experiment was repeated at least three times and included two independent biological replicates each time. The solid bar indicates the average. b Growth curves of lsm1∆ cells overexpressing ALD6 or ICS2 (red) or lsm1∆ cells containing the control vector (black) in the presence of HU. c Serial 10-fold dilutions of the indicated strains were spotted on YPD with or without acetaldehyde. Plates were imaged after 3–4 days of growth. d Left: Heatmap of fitness values of cells grown in presence of acetaldehyde, hydroxyurea or combinations of both drugs. Fitness values are relative to the untreated condition, for three independent replicates. Right: Synergy heatmap. Indicated values correspond to the difference between the observed fitness in the given drug combination and the expected fitness. e Fitness of cells grown in presence of acetaldehyde, hydroxyurea or combination of both drugs at the indicated concentrations. Each data point represents one replicate. P-values are from a Student’s t-test. f Rnr3-GFP intensities in the indicated mutants relative to the WT. Each data point represents one replicate. P-values are from a Student’s t-test. g Representative microscopic images of the indicated strains expressing Rnr3-GFP and RPL39pr-TdTomato. Scale bar: 5 µm. h Cell-cycle progression of the WT and ald6∆ strain after alpha-factor block and release in YPD containing 200 mM of HU

