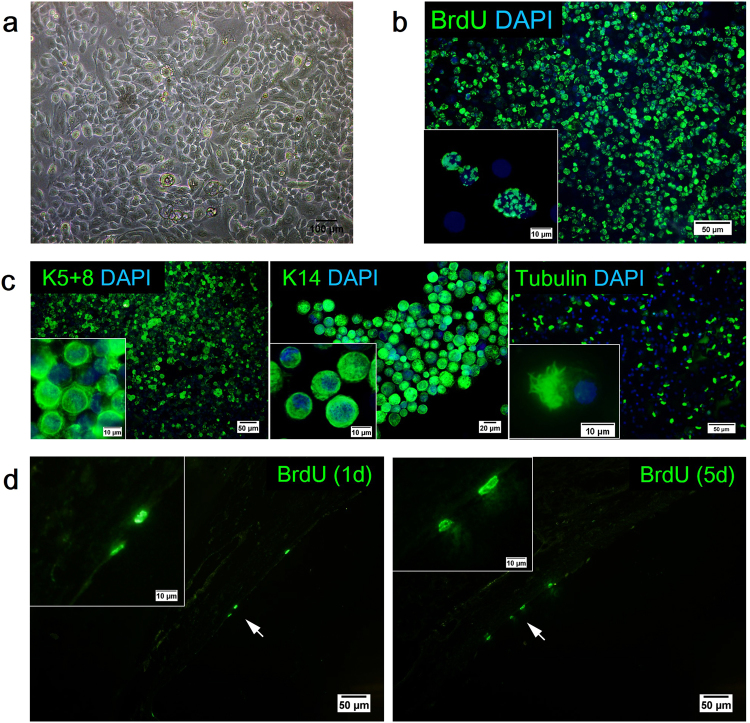
Figure 2.
AEC morphology and characterisation. (a) Phase-contrast micrographs of confluent monolayer of AECs with cobblestone-like appearance. Representative images of DAPI (blue) and (b) BrdU (green) as well as (c) epithelial cell marker K5+8 (green), K14 (green), and tubulin (green) staining of AECs following isolation and culture. The detection of BrdU-labelled cells on the trachea sections following direct co-culture assay. (d) H&E stained trachea sections of anti-BrdU staining (green) following direct co-culture assay (d1 = day 1, d5 = day 5). Arrows indicate BrdU+ cells that formed the lining of epithelium. Insets show the cell(s) at higher magnification (scale bars (a) = 100 μm, (b, c, d) = 50 μm, scale bars of insets represent 10 μm).

