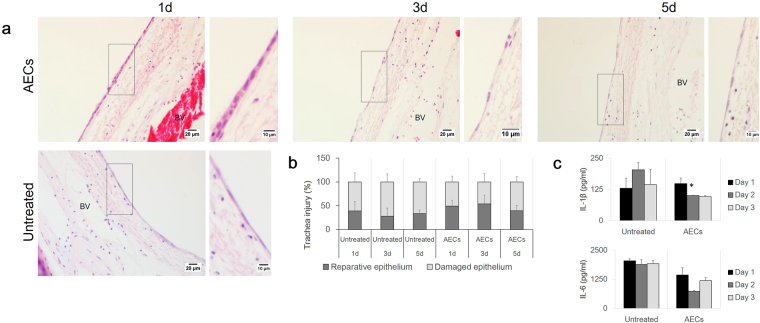
Figure 5.
(a) H&E stained trachea sections following cell treatment in indirect co-culture assay. De-differentiation of a pseudostratified epithelium into flattened epithelial cells was noted in both AEC-treated and untreated group. Inset shows the epithelium layer at higher magnification.(b) The graph illustrates the percentage of damaged and reparative epithelium region following indirect co-culture assay. (c) The graph illustrates the level of IL-1β and IL-6 inflammatory cytokines in response to AEC treatment. Data are represented as mean ± standard deviation; n = 3 tracheal tissue for each group (untreated vs. aec-treated, *P > 0.05) (d1 = day 1, d3 = day 3, d5 = day 5) (scale bars = 20 μm, scale bars of insets represent 10 μm).

