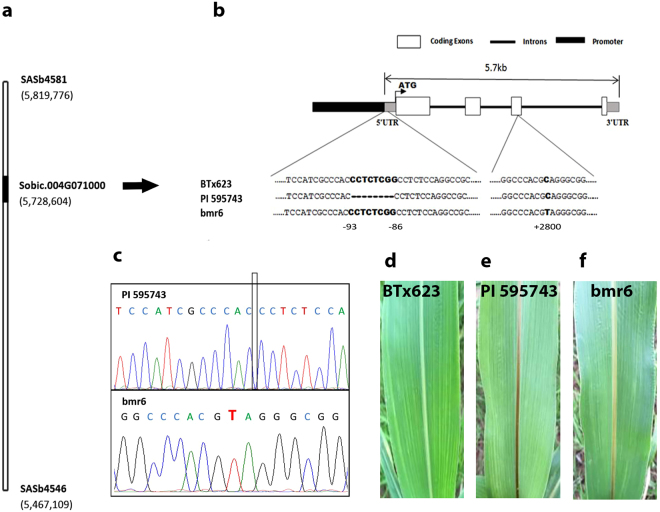
Figure 3.
Map-based cloning of the SbCAD2. (a) Physical map of the target gene flanked by two microsatellite markers with an interval. Target gene Sobic.004G071000 (SbCAD2) is shown in bold. The base pair numbers correspond to the sorghum genome database version 3.1.1 (www.phytozome.net/sorghum). (b) Schematic representation of the SbCAD2 structure and sequence comparison of the SbCAD2 in BTx623, PI 595743 and bmr6. Numbers indicate distances from the start codon. (c) Sequence differences are confirmed by DNA sequencing. Box indicates the 8-bp deletion region in PI 595743. C to T transition in bmr6 is highlighted in red. (d–f) The differences of leaf midrib coloration are observed among BTx623, PI 595743 and bmr6 lines.

