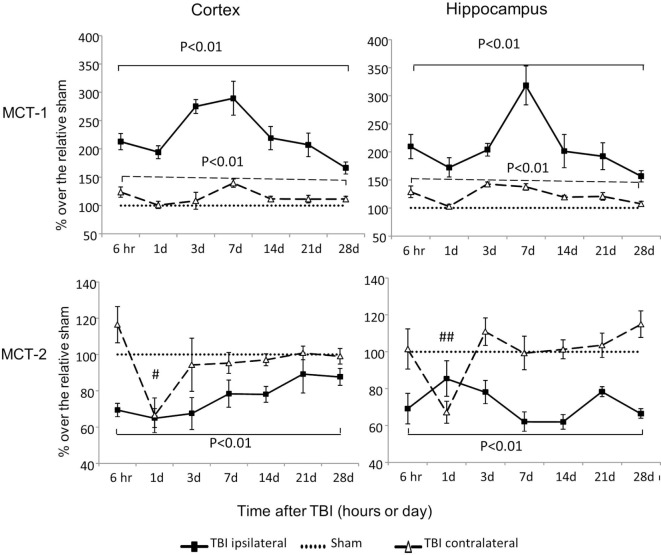
Figure 4.
Monocaboxylate transporter (MCT)-1 and MCT-2 mRNA levels in the cortex and hippocampus measured at different time points postcontrolled cortical impact (post-CCI). Data are mean ± SEM (n = 3–6 per group at each time point). # or ## P < 0.05 or P < 0.01, contralateral cortex or hippocampus of injured mice compared with corresponding tissue obtained from sham-operated mice at indicated single time points. Solid brackets indicate the comparison between the ipsilateral side of the cortex or hippocampus from CCI-injured mice and the corresponding tissue obtained from sham-operated mice. Dashed brackets indicate the comparison between contralateral sides of the cortex or hippocampus from CCI-injured mice and the same sides of corresponding tissue obtained from sham-operated mice.

