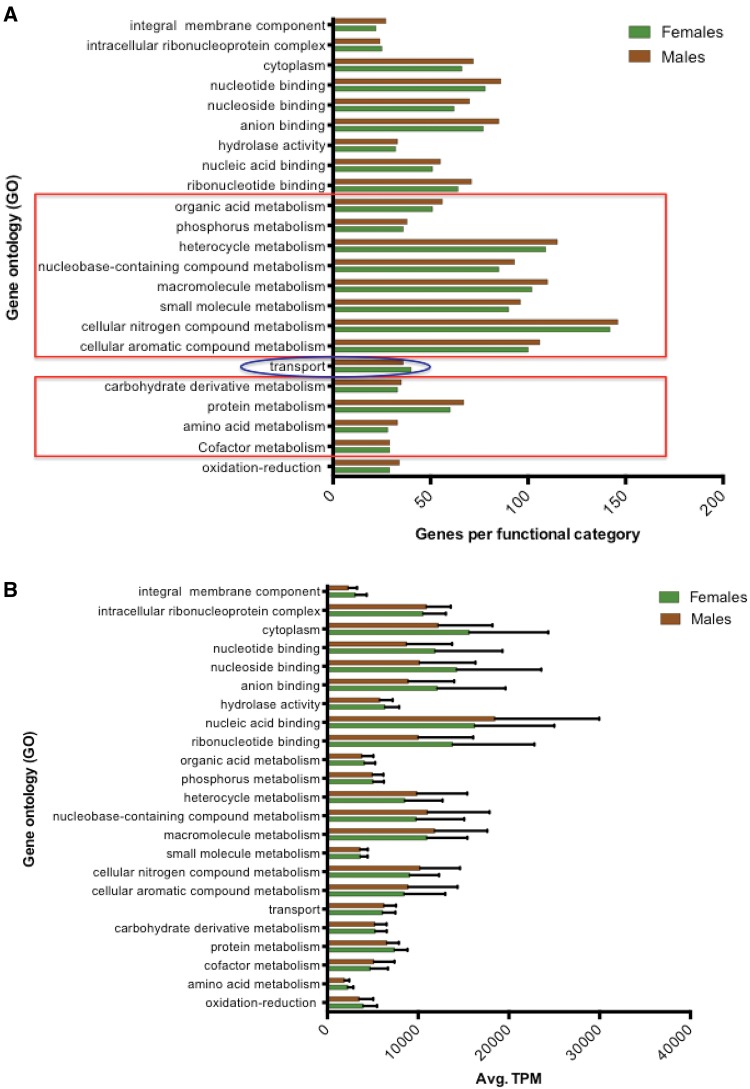
Fig. 2.
—Gene ontology (GO) distribution of Wigglesworthia transcriptome. (A) GO classifications at root level 4 for each Wigglesworthia protein-coding gene (n = 370) expressed. GO terms were determined using BLAST2GO followed by enrichment analyses using Fisher’s exact test with a false rate discovery correction. Red boxes indicate GO classifications associated with metabolism and the blue circle highlights transport. (B) GO classifications normalized to average TPM values. There were no statistically significant differences in mean TPM values either within a given category between male and female bacteriomes or between different categories within the same sex.

