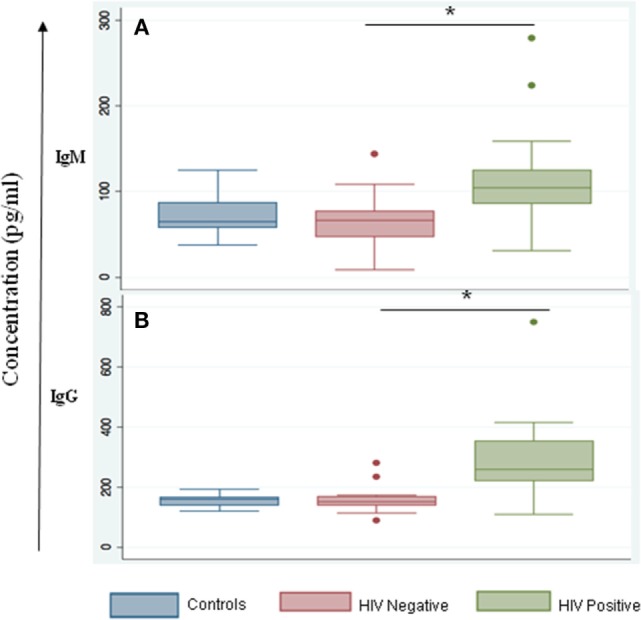
Figure 3.

IgM and IgG serum levels are altered during HIV-tuberculosis (TB) coinfection. Graphical representation of immunoglobulin expression levels measured in control samples that were HIV- and TB-negative (blue); spinal TB-positive but HIV-negative (salmon); spinal TB-positive and HIV-positive (green). (A) Total serum IgM. (B) Total serum IgG (*denotes the statistical significance).
