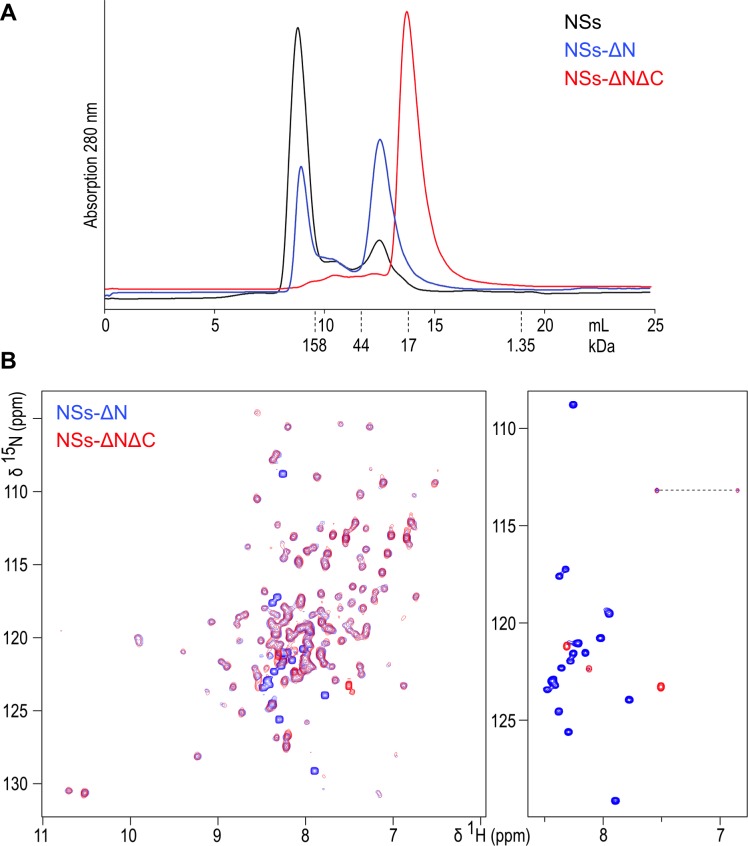
Figure 1. (A) Size exclusion chromatography elution traces of recombinantly expressed NSs variants, detected by UV absorption at 280 nm.
Elution volumes for molecular mass markers used for calibration of the column are indicated with dashed lines. (B) 1H-15N HSQC NMR spectra of NSs-ΔN (blue) and NSs-ΔNΔC (red) overlaid. The right-hand panel shows the central region of the spectra plotted at high contour levels, selecting a subset of intense crosspeaks representing highly dynamic amino acid residues, most of which are not present in NSs-ΔNΔC. The dashed line connects crosspeaks of one side-chain amide.


