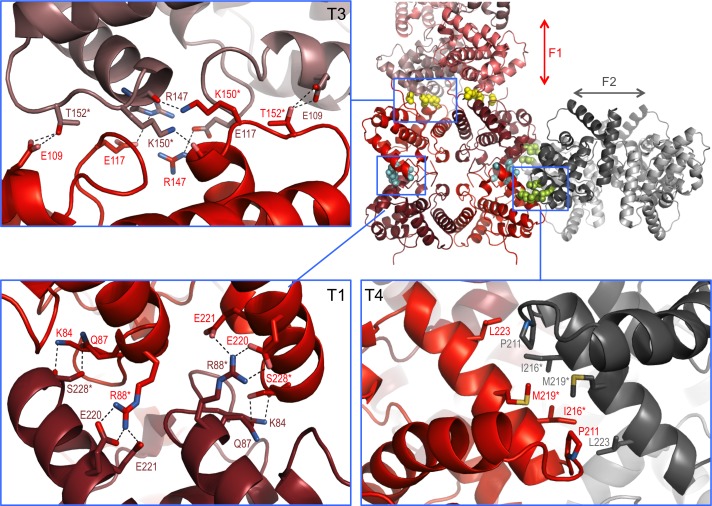
Figure 4. Interaction interfaces within the F1 and F2 fibrils observed in the NSs-ΔNΔC crystal.
In the overview of an F1/F2 node (top right) key interface residues targeted by mutagenesis are shown as cyan, yellow and lime spheres for interfaces in T1, T3 and T4, respectively. Expanded regions highlight the residues involved in the three different interfaces. H-bond networks and salt bridges (dashed black lines) stabilize the interfaces for T3 and T1. The α8-α8 interface in T4 is defined by hydrophobic interactions. Residues changed by mutagenesis are marked by asterisks.


