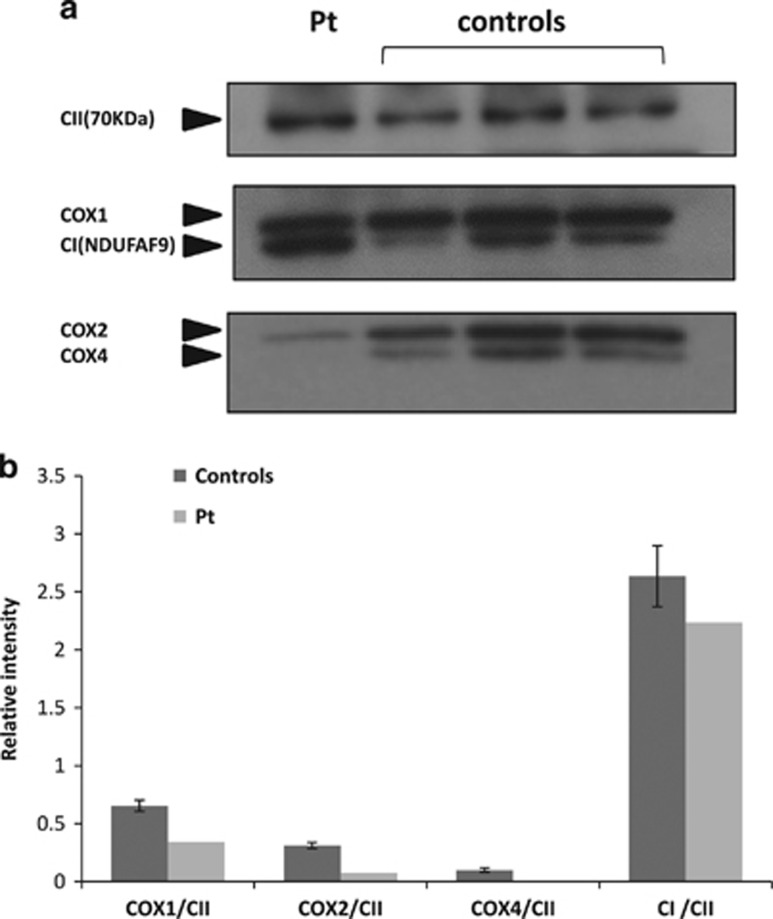
Figure 4.
Western blot analysis. Twenty micrograms protein per slot obtained from mitochondria, isolated from patient (Pt) and controls (n=3) fibroblasts were subjected to Urea-SDS-PAGE and Western blot with antibodies against complexes I (CI), II (CII) and subunits 1, 2 and 4 of complex IV (COX) and visualized by ECL (A). The graph depicts intensities normalized to CII.

