Fig. 5.
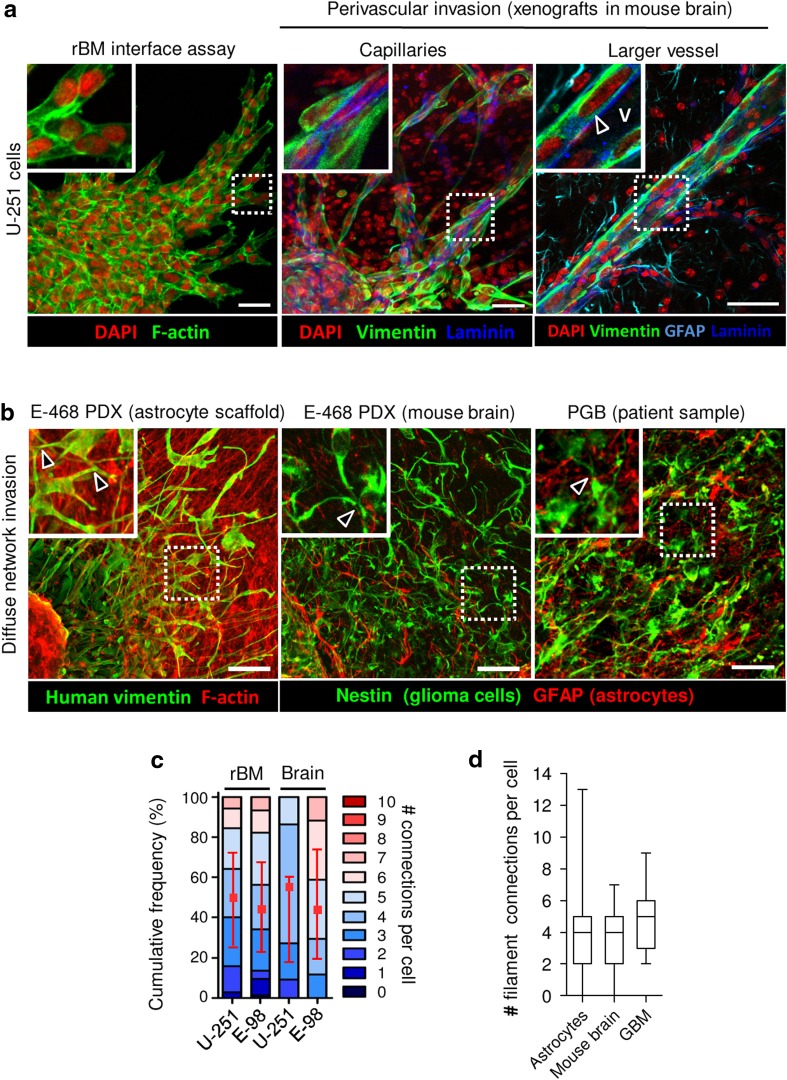
Validation of in vitro assays by glioma invasion in murine and human brain in vivo. a 3D reconstruction of U-251 cell invasion along rBM-plastic interface in vitro compared to invasion pattern in the mouse brain 1 month after orthotopic implantation of U-251 cells. Glioma cells were identified using human-specific anti-vimentin, basement membranes with anti-laminin, and astrocytes and glia limitans perivascularis with anti-GFAP antibody. Arrowhead indicates glioma cells invading along basement membrane of a linear brain vessel under glia limitans. V–vessel lumen. In vivo images are projections from 100 μm-thick z-stacks. b E-468 patient-derived glioblastoma cells invading (2 days) 3D astrocyte scaffolds in vitro, or mouse brain 2 months after orthotopic implantation, compared with the peritumoral region of a primary glioblastoma (PGB) patient sample. Images represent 100 μm-thick z-stacks. Arrowheads denote contacts between glioma cells via dendrite-like filaments. Glioma cells were positive for vimentin (E-468) or nestin (E-468 and human sample), detected with human specific antibodies. Astrocytes were detected by anti-GFAP antibody. c Number of cell–cell junctions between U-251 and E-98 glioma cells in different assays, including collective strands under rBM compared to perivascular invasion in mouse brain. Values represent the number of cell contacts per glioma cell (colour code of stacked boxes) and their relative frequency in the population. The number of connected neighbour cells is indicated as median (red square), 25/75 percentiles (whiskers), representing three independent in vitro experiments and 2 mice per cell line in mouse brain. d Number of filaments connecting glioblastoma cells during astrocyte scaffold invasion compared with mouse brain tissue and primary glioblastoma lesion. Values display median (black line), 25/75 percentiles (boxes) and maximum/minimum (whiskers). Data represent three independent in vitro experiments; two E-468 xenografts in mouse brain, and four glioblastoma patients. Scale bars 50 μm

