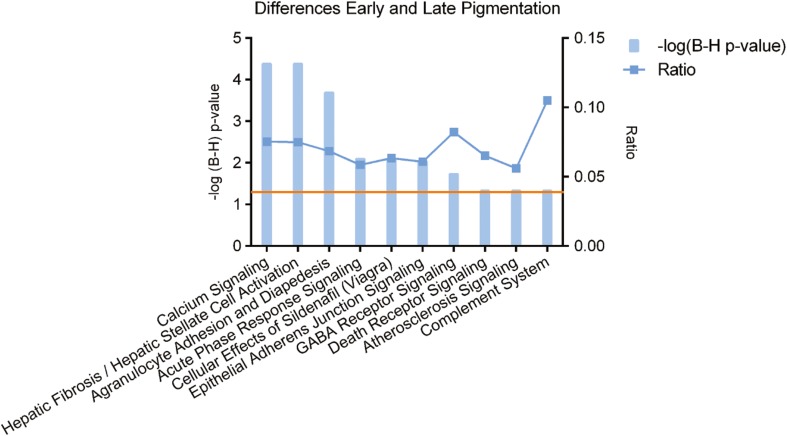
Fig. 3.
Canonical pathways identified by IPA for the genes that are significantly differentially expressed genes between EP and LP samples. The left y-axis displays the –log of the Benjamini-Hochberg corrected –value. The right axis displays the ratio of the number of genes derived from our dataset, divided by the total number of genes in the pathway. The bar graph represents the –log(B-H) p-value. The orange line indicates the threshold at a B-H corrected p-value <0.05

