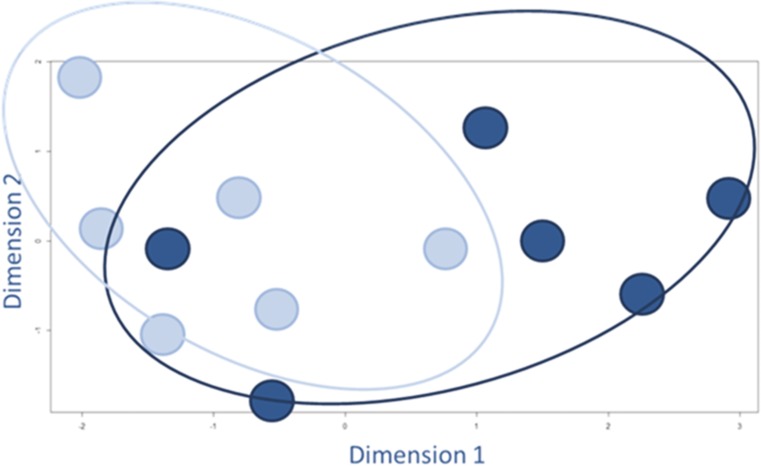
Fig. 4.
Multidimensional scaling plot to visually represent the (dis)similarities among the different hESC-RPE cell samples. The light blue dots represent the individual EP samples and the dark blue dots represent the LP samples. We used the LIMMA package in R, which is specific for the analysis of microarray data, and included all the normalized expression data of the individual samples: 43,376 entries per sample

