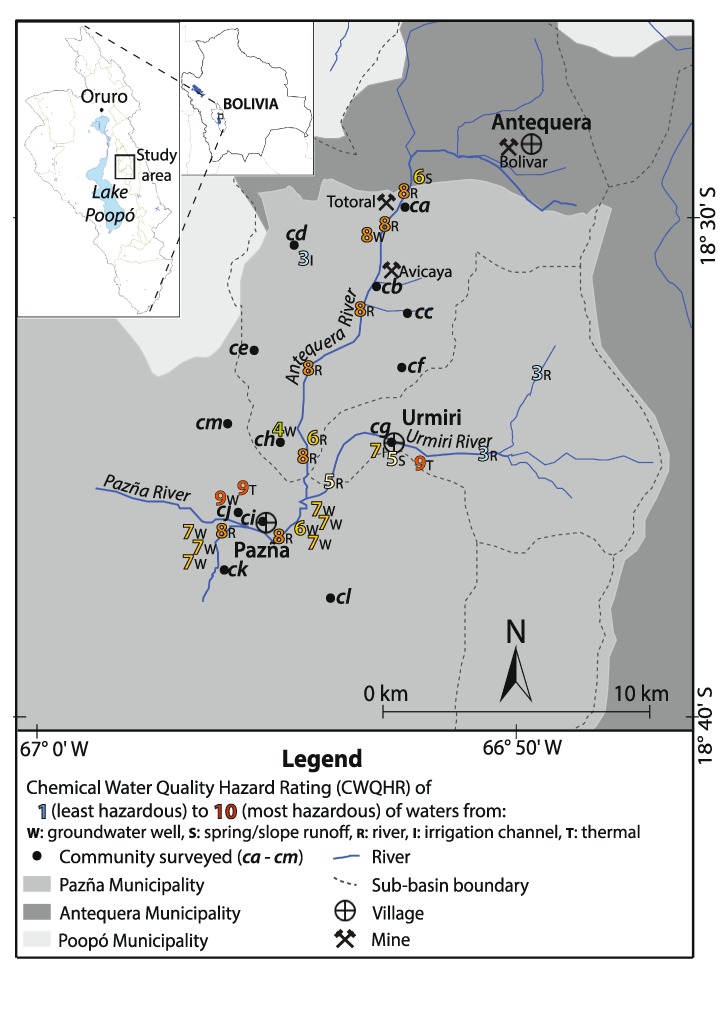
Fig. 6.

Map of study area showing Chemical Water Quality Hazard Index (CWQHR 1–10; least–most hazardous) for sites in 2013–2014 (see Table S6 for CWQHR description, and Fig. 1 for site codes) and communities involved in the vulnerability survey (all determined to be high total vulnerability, Vt 5.0–7.5, Table S3). Inset map shows location of study area within Lake Poopó Basin and Bolivia
