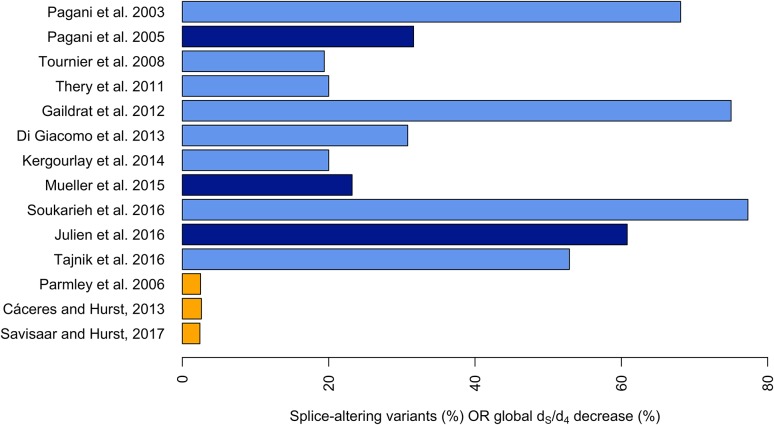
Fig. 1.
Percentage of splice-altering variants among variants tested (blue bars) or over-all percentage decrease in d S (synonymous rate of evolution)/d 4 (fourfold degenerate rate of evolution) attributed to the need to preserve splice control elements (orange bars). The light blue bars correspond to subtype 1 (at least some variants chosen because of disease association) and the dark blue bars to subtype 2 (largely unbiased selection of variants). There is a large discrepancy between blue (experimental) and orange (computational) bars. Note, however, that the figures are directly comparable only if one assumes that the selection detected in the computational studies is strong enough to preclude all substitutions at selected sites (see “It is uncertain how to infer the density of selected sites from the decrease in dS”). Note also that the estimate from Savisaar and Hurst (2017) reflected selection on non-splice related RNA-binding protein target motifs as well

