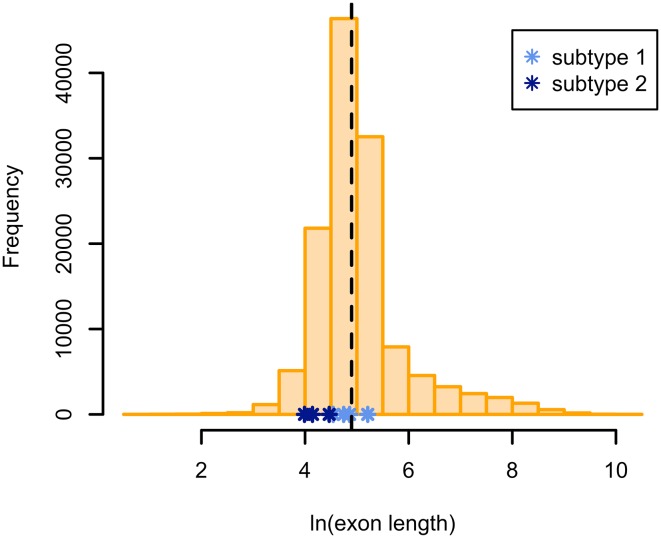
Fig. 2.
The distribution of exon lengths in the human genome is shown in orange (see Online Resource 1 for data). The dashed line marks the median of this distribution. The asterisks mark the natural logs of the lengths of the exons used in the experimental studies (studies that used more than one exon have been excluded). Note that the majority of these values are below the genomic median, and the three subtype 2 studies (dark blue) correspond to particularly low figures

