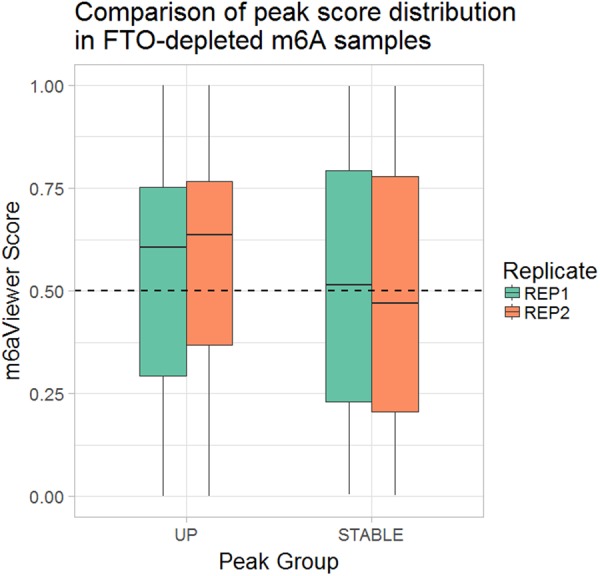
FIGURE 6.

m6aViewer's false-positive filter classifier score distribution in peaks from two FTO-depleted and matched control sample replicates. Two subsets of peaks are compared, a “STABLE” (peaks that show no change in enrichment between FTO-depleted and control samples) subset and an “UP” (peaks that show at least a twofold increase in peak enrichment in FTO-depleted samples over control samples) subset. In replicate 1, 51.21% of stable peaks and 65.64% of up-regulated peaks were scored 0.5 or higher; in replicate 2, the difference between score distributions was more pronounced, with 47.87% of stable and 70.13% of up-regulated peaks scoring 0.5 or higher. At a lower threshold of 0.4, in replicate 1, 71.26% of up-regulated peaks and 58.78% of stable peaks are classified as true positives; in replicate 2, 54.28% of stable and 75.34% of up-regulated peaks are classified as true positives.
