FIGURE 6.
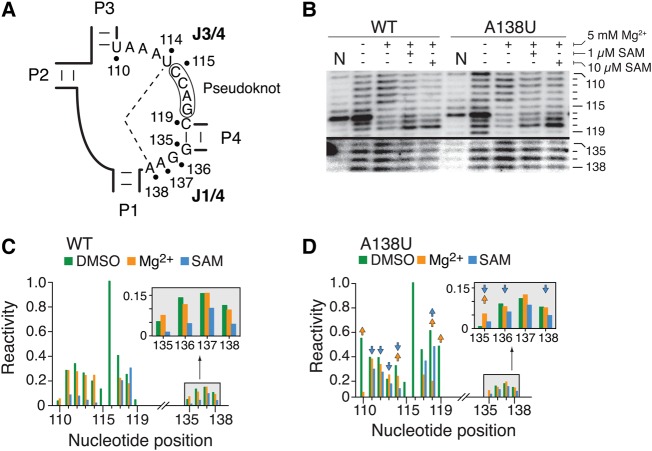
NMIA probing of the wild-type and A138U aptamers. (A) Schematic representing the J1/4 and J3/4 regions of the SAM-I aptamer. The long-range U114–A138 base pair is shown by a dashed line. (B) SHAPE modifications of the wild-type and A138U SAM-I aptamers. Reactions were performed in the absence or presence of Mg2+ or SAM. Only regions corresponding to J3/4 (110–119 nt) and J1/4 (135–138 nt) are shown. Control reactions were done in which DMSO was used instead of NMIA (N). The complete gel is shown in Supplemental Figure S1A. (C,D) NMIA chemical reactivity (normalized units) of the wild-type (C) and A138U (D) aptamer according to nucleotide positions. Reactions were performed in the absence or in the presence of 5 mM Mg2+ (Mg2+), or in the presence of 5 mM Mg2+ and 1 µM SAM (SAM). Only regions corresponding to J3/4 (110–119 nt) and J1/4 (135–138 nt) are shown. Arrows represent a folding effect in the A138U mutant that is at least 1.8-fold smaller (downward pointing) or greater (upward pointing) than the value observed in the context of the wild-type aptamer. The insets represent a magnification of the 135–138 nt region. Complete quantifications are shown in Supplemental Figure S1B.

