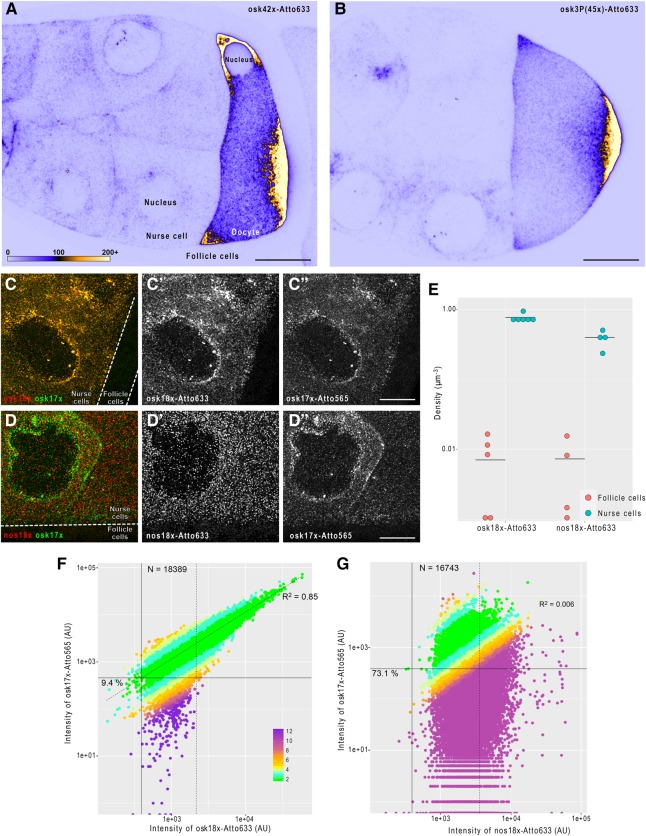
FIGURE 3.
smFISH carried out using 3′ end labeled probe mixtures. (A,B) Fluorescent in situ hybridization of oskar mRNA in mid-oogenetic Drosophila egg chambers using a set of 42 enzymatically produced antisense oligonucleotides (A) or a set of 45 chemically labeled smFISH probes (B [Little et al. 2015]). Posterior poles, where oskar mRNA localizes, face toward the right of the panels. Sum intensity projections of 11 optical slices (a total 2 µm depth) of raw confocal images are shown. Pixels represent absolute photon counts (see panel A for key). Scale bars are 20 µm. (C–C″) smFISH of oskar mRNA in a developing Drosophila egg chamber using osk18×–Atto633 (red, C′) and osk17×–Atto565 (green, C″) probe sets. The two probes sets label oskar mRNA in an alternating fashion. (D–D″) smFISH of oskar and nanos mRNAs in a developing Drosophila egg chamber using nos18×–Atto633 (red, D′) and osk17×–Atto565 (green, D″) probe sets. (C–D″) The germline, which expresses oskar and nanos mRNAs (nurse cells) and the soma (follicle cells), is indicated. Scale bars are 10 µm. (E) Density of detected smFISH signal in the mRNA expressing (cyan, nurse cells) and nonexpressing (red, follicle cells) compartments of the egg chambers. Horizontal lines indicate the mean value of observations. (F,G) Intensity of osk17×–Atto565 probe sets (target channel) as a function of Atto633 signal intensity (reference channel) of smFISH objects detected by the fluorescence of osk18×–Atto633 (F) or nos18×–Atto633 (G) probe sets (reference channel). Percentage values represent the fraction of single mRNA containing smFISH objects that would have failed to be detected in the target channel (Atto 565) since their corresponding signal intensity falls below the estimated target channel detection threshold (solid horizontal line). This detection threshold corresponds to the product of the reference channel detection threshold (solid vertical line, 0.1th percentile of the Atto633 signal intensity distribution) and the slope of the fitted line (dashed line. The line was fitted to the nonsingle mRNA representing fraction of the population; goodness-of-fit indicated). smFISH objects with signal intensity lower than µ1 + 2σ1 of the smallest fitted Gaussian function (Supplemental Fig. S2) were considered to represent a single mRNA molecule (dashed vertical line). Numbers of these single copy mRNA objects are indicated in the graphs. Colors represent the relative fold difference of the observed and expected target channel (Atto565) signals (see panel F for key). The expected target channel (Atto565) signal is calculated as the product of the regression slope and the reference channel (Atto633) fluorescence.

