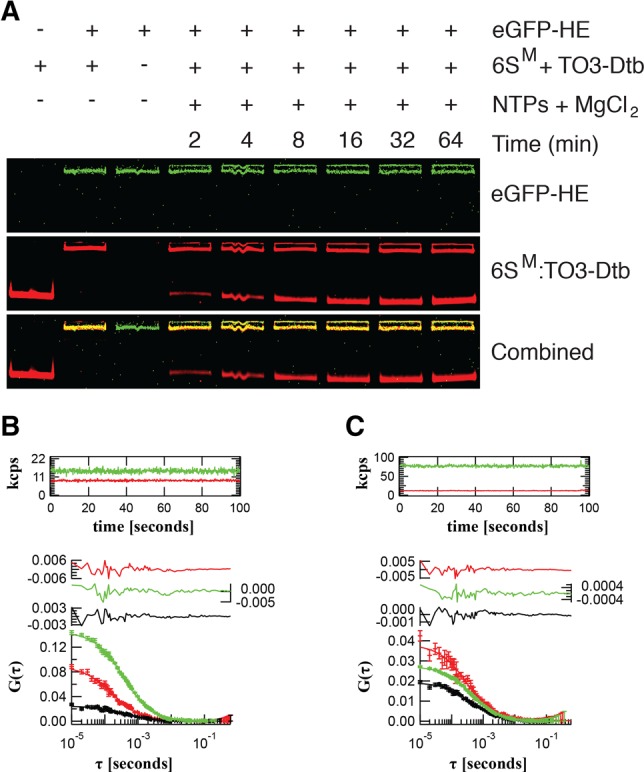
FIGURE 4.

Multiwavelength fluorescence characterization of the 6SM:HE complex. (A) EMSA assay of the 6SM:eGFP-HE complex visualized using eGFP-HE (green, top) and 6SM:TO3-Dtb (red, middle) fluorescence. The bottom panel is the composite of the green and red images. Product RNA (pRNA) release was induced by the addition of NTPs and MgCl2. (B) Fluorescence auto- and cross-correlation spectroscopy of 6SM:TO3-Dtb (red) in the presence of 25.4 ± 0.3 nM free eGFP-HE (green) and 1% 6SM:eGFP-HE complex (yellow, cross-correlation amplitude). (C) 6SM:TO3-Dtb (red) in the presence of 127.5 ± 0.9 nM (right) free eGFP-HE (green) and 20% 6SM:eGFP-HE complex (yellow, cross-correlation amplitude). Fluorescence intensity traces in thousands of photon counts per second (kcps, both red and green channels) are shown in the top panels. Residuals are shown in the middle panels. Correlation functions are shown in the bottom panels.
